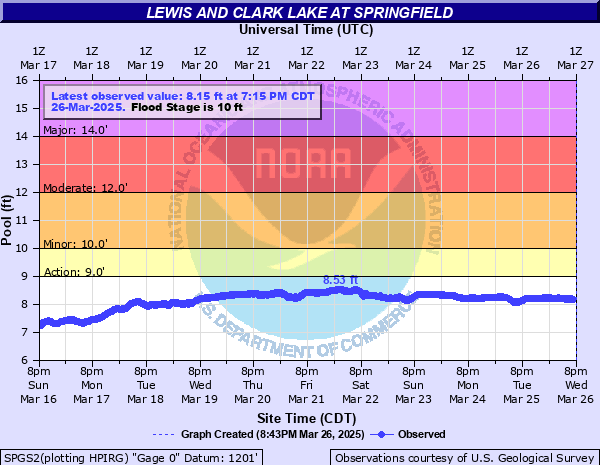
Missouri River at Springfield
Critical Stages
9.4' - Action
11' - Flood
13' - Moderate
15' - Major
Latest Observation
Updated: 9:15 PM CST 12/14/25
Status: No Flooding
Stage: 8.48 ft
Flow: -999 kcfs
Forecast
Forecast not available for this location.
| Time | Stage (ft) | Flow (kcfs) |
|---|---|---|
| 9:15 PM 12/14 | 8.48 | -999 |
| 9:00 PM 12/14 | 8.47 | -999 |
| 8:45 PM 12/14 | 8.48 | -999 |
| 8:30 PM 12/14 | 8.47 | -999 |
| 8:15 PM 12/14 | 8.48 | -999 |
| 8:00 PM 12/14 | 8.48 | -999 |
| 7:45 PM 12/14 | 8.48 | -999 |
| 7:30 PM 12/14 | 8.48 | -999 |
| 7:15 PM 12/14 | 8.5 | -999 |
| 7:00 PM 12/14 | 8.5 | -999 |
| 6:45 PM 12/14 | 8.5 | -999 |
| 6:30 PM 12/14 | 8.5 | -999 |
| 6:15 PM 12/14 | 8.52 | -999 |
| 6:00 PM 12/14 | 8.51 | -999 |
| 5:45 PM 12/14 | 8.52 | -999 |
| 5:30 PM 12/14 | 8.53 | -999 |
| 5:15 PM 12/14 | 8.55 | -999 |
| 5:00 PM 12/14 | 8.55 | -999 |
| 4:45 PM 12/14 | 8.55 | -999 |
| 4:30 PM 12/14 | 8.55 | -999 |
| 4:15 PM 12/14 | 8.55 | -999 |
| 4:00 PM 12/14 | 8.54 | -999 |
| 3:45 PM 12/14 | 8.57 | -999 |
| 3:30 PM 12/14 | 8.59 | -999 |
| 3:15 PM 12/14 | 8.61 | -999 |
| 3:00 PM 12/14 | 8.62 | -999 |
| 2:45 PM 12/14 | 8.61 | -999 |
| 2:30 PM 12/14 | 8.62 | -999 |
| 2:15 PM 12/14 | 8.63 | -999 |
| 2:00 PM 12/14 | 8.66 | -999 |
15' -
Access to several homes east of the boat ramp in Santee may be cut off as most of the parking lot is flooded. Most of the park in Springfield is flooded.
13.5' -
Boat Basin Dr in Springfield floods. Water reaches the top of the boat ramp in Santee.
13' -
The lowest portion of the parking lot at the boat ramp in Santee begins to flood. Water approaches Boat Basin Dr in Springfield and may flood the lowest portions.
12' -
The lowest portions of Springfield Recreational Area will be begin to flood.
11' -
The lowest portions of the park in Springfield begin to flood.
9.4' -
The lowest portions of Bottom Rd begin to flood just under 9.5 feet and the road may need to be closed.
| Date | Stage (ft) |
|---|---|
| Mar 14, 2019 | 17.73 |
| Jun 22, 2011 | 14.72 |
| Oct 14, 2018 | 12 |
| Sep 20, 2018 | 11.9 |
| Aug 23, 1995 | 11.89 |
| Sep 24, 2010 | 11.7 |
| Feb 21, 1997 | 11.43 |
| Jan 11, 2016 | 11.32 |
| Dec 2, 1985 | 11.13 |
| Mar 2, 1996 | 10.74 |
| Oct 31, 1997 | 10.69 |
| Jan 18, 1987 | 10.63 |
| Jun 23, 2024 | 10.53 |
| Jan 1, 1983 | 10.36 |
| Sep 20, 2009 | 10.19 |
| Jan 1, 1999 | 10.15 |
| Oct 14, 2023 | 10.14 |
| Dec 25, 1993 | 10.12 |
| Dec 27, 1983 | 10.1 |
| Dec 22, 1984 | 10.03 |
Data provided by the National Weather Service.