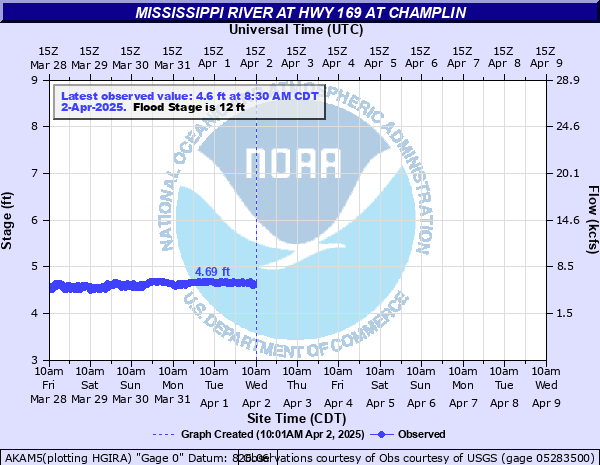
Mississippi River at Hwy 169 at Champlin
Critical Stages
9' - Action
12' - Flood
14' - Moderate
17' - Major
Latest Observation
Updated: 9:30 AM CST 12/6/25
Status: No Flooding
Stage: 4.43 ft
Flow: 3.95 kcfs
Forecast
Forecast not available for this location.
| Time | Stage (ft) | Flow (kcfs) |
|---|---|---|
| 9:30 AM 12/6 | 4.43 | 3.95 |
| 9:15 AM 12/6 | 4.43 | 3.95 |
| 9:00 AM 12/6 | 4.43 | 3.95 |
| 8:45 AM 12/6 | 4.43 | 3.95 |
| 8:30 AM 12/6 | 4.44 | 4.03 |
| 8:15 AM 12/6 | 4.44 | 4.03 |
| 8:00 AM 12/6 | 4.44 | 4.03 |
| 7:45 AM 12/6 | 4.45 | 4.11 |
| 7:30 AM 12/6 | 4.45 | 4.11 |
| 7:15 AM 12/6 | 4.45 | 4.11 |
| 7:00 AM 12/6 | 4.45 | 4.11 |
| 6:45 AM 12/6 | 4.46 | 4.2 |
| 6:30 AM 12/6 | 4.46 | 4.2 |
| 6:15 AM 12/6 | 4.46 | 4.2 |
| 6:00 AM 12/6 | 4.47 | 4.28 |
| 5:45 AM 12/6 | 4.47 | 4.28 |
| 5:30 AM 12/6 | 4.48 | 4.37 |
| 5:15 AM 12/6 | 4.47 | 4.28 |
| 5:00 AM 12/6 | 4.48 | 4.37 |
| 4:45 AM 12/6 | 4.48 | 4.37 |
| 4:30 AM 12/6 | 4.48 | 4.37 |
| 4:15 AM 12/6 | 4.48 | 4.37 |
| 4:00 AM 12/6 | 4.49 | 4.46 |
| 3:45 AM 12/6 | 4.49 | 4.46 |
| 3:30 AM 12/6 | 4.49 | 4.46 |
| 3:15 AM 12/6 | 4.49 | 4.46 |
| 3:00 AM 12/6 | 4.49 | 4.46 |
| 2:45 AM 12/6 | 4.49 | 4.46 |
| 2:30 AM 12/6 | 4.49 | 4.46 |
| 2:15 AM 12/6 | 4.49 | 4.46 |
17.8' -
Anoka - Rum River begins flooding River Avenue and Madison Street
17.3' -
Anoka - Rum River begins flooding 2nd Avenue and Adams Street.
17' -
Champlin - water backs up through sewer manholes at Applewood Pointe on Dayton Road
14.6' -
Anoka - water begins flooding Rice Street and Levee Avenue.
14.2' -
Anoka - water begins flooding the Rum River boat launch walkway.
13.5' -
Champlin - flooding begins on West River Parkway upstream from gage
11.26' -
Watercraft restrictions begin.
11' -
Champlin - flooding begins upstream of gage at Galloway Park
10.8' -
Champlin - some flooding downstream of gage on Mississippi Drive
9.4' -
Champlin - some flooding 3-4 miles downstream of gage below West River Road
9' -
Champlin - low parking lot off 411 Dayton Road begins to flood.
8.8' -
Champlin - low areas of Mississippi Point Park begin to flood.
| Date | Stage (ft) |
|---|---|
| Apr 12, 1965 | 17.96 |
| Apr 17, 1965 | 17.66 |
| Mar 6, 1984 | 17.56 |
| Mar 29, 1957 | 15.81 |
| Apr 15, 1952 | 15.46 |
| Apr 9, 1997 | 14.76 |
| Apr 20, 2023 | 14.29 |
| Jun 17, 1966 | 13.66 |
| Apr 15, 2001 | 13.36 |
| Jan 13, 2020 | 13.11 |
| Apr 7, 1952 | 13.06 |
| Apr 16, 1960 | 12.66 |
| Apr 29, 2001 | 12.46 |
| Mar 31, 2019 | 11.94 |
| May 18, 2022 | 11.87 |
| Apr 10, 2011 | 10.76 |
| Apr 28, 2018 | 9.59 |
| Oct 10, 2017 | 9.11 |
| Apr 16, 2021 | 8.04 |
Data provided by the National Weather Service.