South Fork Crow River at Delano
Critical Stages
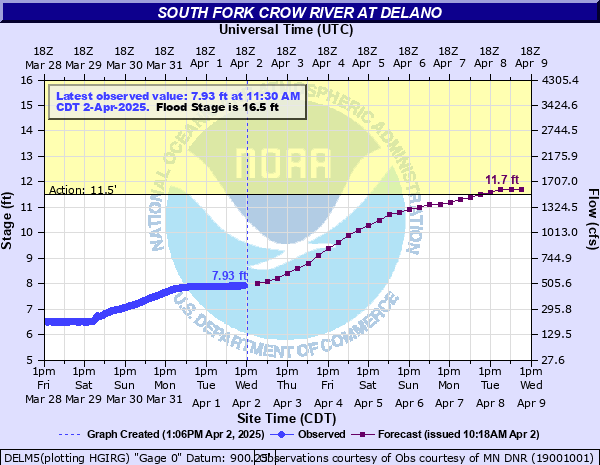
11.5' - Action
16.5' - Flood
17.5' - Moderate
18.5' - Major
Latest Observation
Updated: 8:30 AM CST 12/6/25
Status: No Flooding
Stage: 6.12 ft
Flow: 0.118 kcfs
Forecast
Forecast not available for this location.
| Time | Stage (ft) | Flow (kcfs) |
|---|---|---|
| 9:30 AM 12/6 | 6.11 | 0.116 |
| 9:15 AM 12/6 | 6.11 | 0.116 |
| 9:00 AM 12/6 | 6.11 | 0.116 |
| 8:45 AM 12/6 | 6.11 | 0.116 |
| 8:30 AM 12/6 | 6.12 | 0.118 |
| 8:15 AM 12/6 | 6.12 | 0.118 |
| 8:00 AM 12/6 | 6.12 | 0.118 |
| 7:45 AM 12/6 | 6.12 | 0.118 |
| 7:30 AM 12/6 | 6.12 | 0.118 |
| 7:15 AM 12/6 | 6.12 | 0.118 |
| 7:00 AM 12/6 | 6.13 | 0.119 |
| 6:45 AM 12/6 | 6.13 | 0.119 |
| 6:30 AM 12/6 | 6.13 | 0.119 |
| 6:15 AM 12/6 | 6.13 | 0.119 |
| 6:00 AM 12/6 | 6.13 | 0.119 |
| 5:45 AM 12/6 | 6.14 | 0.12 |
| 5:30 AM 12/6 | 6.14 | 0.12 |
| 5:15 AM 12/6 | 6.14 | 0.12 |
| 5:00 AM 12/6 | 6.14 | 0.12 |
| 4:45 AM 12/6 | 6.14 | 0.12 |
| 4:30 AM 12/6 | 6.15 | 0.122 |
| 4:15 AM 12/6 | 6.15 | 0.122 |
| 4:00 AM 12/6 | 6.15 | 0.122 |
| 3:45 AM 12/6 | 6.15 | 0.122 |
| 3:30 AM 12/6 | 6.15 | 0.122 |
| 3:15 AM 12/6 | 6.15 | 0.122 |
| 3:00 AM 12/6 | 6.16 | 0.123 |
| 2:45 AM 12/6 | 6.16 | 0.123 |
| 2:30 AM 12/6 | 6.16 | 0.123 |
| 2:15 AM 12/6 | 6.16 | 0.123 |
25' -
Water may reach top of improved levee at 2nd and River Streets.
24.95' -
Water begins to flow over the levee on the west side of town.
21.85' -
Water may begin to flow over the bridge on Bridge Street.
20.3' -
Water seeps through east bank along N River Street/CR 17.
20' -
Flooding occurs on 90th St SE and approaches County Rd 17 by 20.5 ft.
18.95' -
Sanitary sewers may need plugging at this stage to prevent water from backing up into homes.
18.5' -
When river reaches 18.5 ft and is rising, flood walls may be installed on both sides of Bridge Ave in Delano.
18.35' -
Lowlands on the southwest portion of Delano begin to experience flooding.
16.85' -
Storms sewers may need plugging to prevent river water from backing up into city streets.
15.35' -
Water begins encroaching on Mill Avenue north of Watertown.
14.85' -
Basement flooding may begin at homes close to the river.
| Date | Stage (ft) |
|---|---|
| Apr 14, 1965 | 23.25 |
| Jun 24, 2014 | 21.02 |
| Apr 12, 1969 | 20.45 |
| Apr 24, 2023 | 20.39 |
| Mar 21, 2010 | 20.3 |
| Mar 28, 2011 | 20 |
| Apr 15, 2001 | 19.95 |
| Jun 24, 2024 | 19.44 |
| Apr 8, 1997 | 19.25 |
| Mar 28, 2019 | 19.23 |
| Apr 30, 2001 | 18.85 |
| Sep 16, 1991 | 18.75 |
| Jun 25, 1993 | 18.75 |
| Jul 8, 1993 | 18.65 |
| Apr 8, 2011 | 18.65 |
| Jun 29, 2013 | 17.9 |
| Oct 11, 2017 | 17.56 |
| Jun 29, 2002 | 17.55 |
| May 1, 1975 | 17.55 |
| Jun 25, 2012 | 17.17 |
Data provided by the National Weather Service.