« Back to Boulder Public Library Rivers
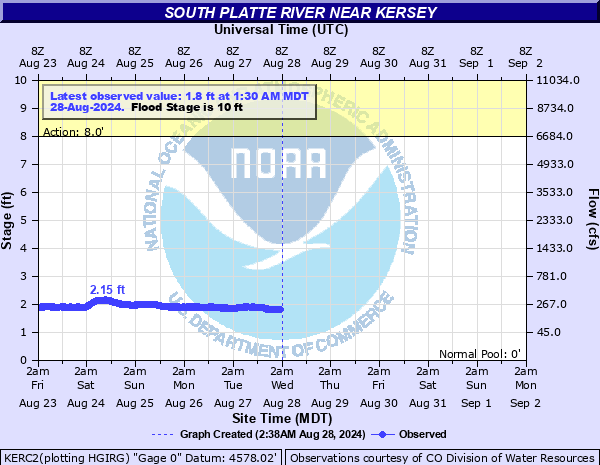
South Platte River near Kersey
Critical Stages
8' - Action
10' - Flood
11.5' - Moderate
13.5' - Major
Latest Observation
Updated: 6:30 AM MST 12/6/25
Status: No Flooding
Stage: 3.22 ft
Flow: 0.847 kcfs
Forecast
Forecast not available for this location.
| Time | Stage (ft) | Flow (kcfs) |
|---|---|---|
| 7:30 AM 12/6 | 3.24 | 0.86 |
| 7:15 AM 12/6 | 3.24 | 0.86 |
| 7:00 AM 12/6 | 3.24 | 0.86 |
| 6:45 AM 12/6 | 3.22 | 0.847 |
| 6:30 AM 12/6 | 3.22 | 0.847 |
| 6:15 AM 12/6 | 3.25 | 0.866 |
| 6:00 AM 12/6 | 3.26 | 0.873 |
| 5:45 AM 12/6 | 3.24 | 0.86 |
| 5:30 AM 12/6 | 3.23 | 0.853 |
| 5:15 AM 12/6 | 3.25 | 0.866 |
| 5:00 AM 12/6 | 3.25 | 0.866 |
| 4:45 AM 12/6 | 3.24 | 0.86 |
| 4:30 AM 12/6 | 3.23 | 0.853 |
| 4:15 AM 12/6 | 3.25 | 0.866 |
| 4:00 AM 12/6 | 3.26 | 0.873 |
| 3:45 AM 12/6 | 3.26 | 0.873 |
| 3:30 AM 12/6 | 3.26 | 0.873 |
| 3:15 AM 12/6 | 3.23 | 0.853 |
| 3:00 AM 12/6 | 3.25 | 0.866 |
| 2:45 AM 12/6 | 3.26 | 0.873 |
| 2:30 AM 12/6 | 3.24 | 0.86 |
| 2:15 AM 12/6 | 3.26 | 0.873 |
| 2:00 AM 12/6 | 3.27 | 0.879 |
| 1:45 AM 12/6 | 3.26 | 0.873 |
| 1:30 AM 12/6 | 3.23 | 0.853 |
| 1:15 AM 12/6 | 3.23 | 0.853 |
| 1:00 AM 12/6 | 3.23 | 0.853 |
| 12:45 AM 12/6 | 3.24 | 0.86 |
| 12:30 AM 12/6 | 3.24 | 0.86 |
| 12:15 AM 12/6 | 3.24 | 0.86 |
15' -
Stage and flow are approaching the maximum record flood occurring in 2013.
14' -
Widespread major flooding occurs as a wide expanse of the river spreads out laterally beyond the floodplain.
13.5' -
Numerous bridges crossing the South Platte River flood. There is extensive flooding of agricultural land and inundation of structures and roads along the river.
12' -
The river floods La Salle and Evans.
11.5' -
Southern sections of Hardin flood. There is moderate flooding of agricultural land along the river.
10' -
Considerable lowland and meadow flooding occurs. This level represents a flood that has a 10-percent chance of being equaled or exceeded in any given year. For more information click <a href="inundation/faq_google.php">here</a>.
8' -
The river is out of its banks and into fields and meadows.
| Date | Stage (ft) |
|---|---|
| Sep 14, 2013 | 15.09 |
| May 8, 1973 | 11.73 |
| May 11, 2015 | 11.54 |
| May 1, 1999 | 11.5 |
| May 31, 1995 | 11 |
| Jun 18, 1965 | 10.75 |
| May 8, 1969 | 10.7 |
| Jun 14, 1997 | 10.4 |
| Jun 14, 2010 | 10.39 |
| May 2, 1980 | 10.31 |
| May 10, 1957 | 10.26 |
| Jun 14, 1983 | 10 |
| Jun 2, 2014 | 9.94 |
| Sep 4, 1938 | 9.73 |
| Jun 15, 1949 | 9.66 |
| Jun 24, 1947 | 9.62 |
| Jul 15, 2011 | 9.58 |
| Apr 25, 1942 | 9.5 |
| Jun 5, 2005 | 9.49 |
| Jun 13, 1970 | 9.46 |
Data provided by the National Weather Service.