« Back to Boulder Public Library Rivers
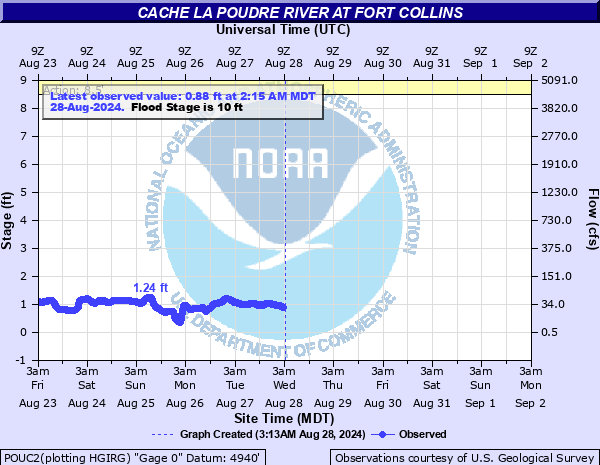
Cache La Poudre River (CO) at Fort Collins
Critical Stages
8.5' - Action
10' - Flood
11' - Moderate
12' - Major
Latest Observation
Updated: 7:15 AM MST 12/6/25
Status: No Flooding
Stage: 0.79 ft
Flow: -999 kcfs
Forecast
Forecast not available for this location.
| Time | Stage (ft) | Flow (kcfs) |
|---|---|---|
| 7:15 AM 12/6 | 0.79 | -999 |
| 7:10 AM 12/6 | 0.79 | -999 |
| 7:05 AM 12/6 | 0.79 | -999 |
| 7:00 AM 12/6 | 0.79 | -999 |
| 6:55 AM 12/6 | 0.79 | -999 |
| 6:50 AM 12/6 | 0.79 | -999 |
| 6:45 AM 12/6 | 0.79 | -999 |
| 6:40 AM 12/6 | 0.79 | -999 |
| 6:35 AM 12/6 | 0.8 | -999 |
| 6:30 AM 12/6 | 0.8 | -999 |
| 6:25 AM 12/6 | 0.79 | -999 |
| 6:20 AM 12/6 | 0.79 | -999 |
| 6:15 AM 12/6 | 0.8 | -999 |
| 6:10 AM 12/6 | 0.8 | -999 |
| 6:05 AM 12/6 | 0.8 | -999 |
| 6:00 AM 12/6 | 0.8 | -999 |
| 5:55 AM 12/6 | 0.8 | -999 |
| 5:50 AM 12/6 | 0.8 | -999 |
| 5:45 AM 12/6 | 0.8 | -999 |
| 5:40 AM 12/6 | 0.8 | -999 |
| 5:35 AM 12/6 | 0.8 | -999 |
| 5:30 AM 12/6 | 0.8 | -999 |
| 5:25 AM 12/6 | 0.8 | -999 |
| 5:20 AM 12/6 | 0.81 | -999 |
| 5:15 AM 12/6 | 0.8 | -999 |
| 5:10 AM 12/6 | 0.81 | -999 |
| 5:05 AM 12/6 | 0.81 | -999 |
| 5:00 AM 12/6 | 0.81 | -999 |
| 4:55 AM 12/6 | 0.81 | -999 |
| 4:50 AM 12/6 | 0.81 | -999 |
12' -
College Avenue (U.S. Highway 287) is overtopped north of the Cache La Poudre River Bridge and the flow is directed along East Vine past Redwood Street. Water inundates businesses along East Prospect Road and East Mulberry Street.
11.8' -
There is a 2 percent chance in any given year of reaching a flood of this magnitude.
10.5' -
Water inundates businesses along the east side of North College Avenue, East Vine Drive, and East Lincoln Avenue. Structures flood on the south side of East Mulberry Street along the river. The river also begins to impact structures along East Prospect Road.
8.5' -
The Cache La Poudre River is out of its banks in and near Fort Collins. Water will flow onto bike paths in low lying areas.
| Date | Stage (ft) |
|---|---|
| Sep 13, 2013 | 11.56 |
| Apr 30, 1999 | 10.46 |
| May 31, 2014 | 9.54 |
| Jun 12, 2010 | 9.27 |
| Jun 12, 2015 | 8.49 |
| Jun 9, 2011 | 7.88 |
| Jun 9, 1997 | 7.22 |
| Jun 12, 2016 | 7.21 |
| May 27, 2017 | 7.05 |
| May 23, 2021 | 6.8 |
| May 30, 2003 | 6.42 |
| Jun 1, 2020 | 6.31 |
| Jun 7, 2008 | 6.15 |
| Jun 22, 2009 | 6.1 |
| Jun 4, 2005 | 6 |
| Jul 1, 2019 | 5.74 |
| May 28, 2018 | 5.49 |
| Oct 30, 2005 | 5.31 |
| Jul 1, 2004 | 5 |
| Jun 13, 2007 | 4.86 |
Data provided by the National Weather Service.