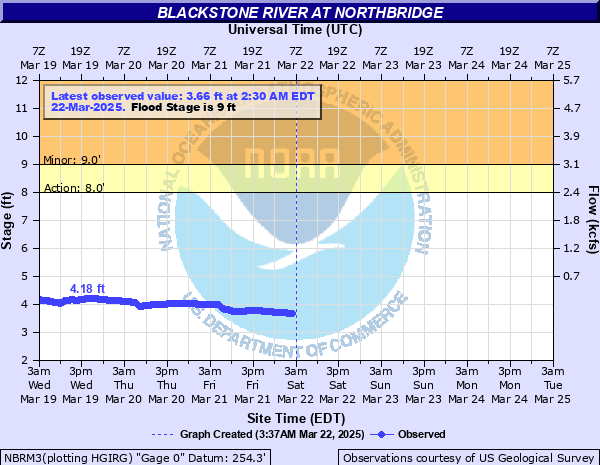
Blackstone River at Northbridge
Critical Stages
8' - Action
9' - Flood
12' - Moderate
14' - Major
Latest Observation
Updated: 6:30 PM EST 12/6/25
Status: No Flooding
Stage: 3.7 ft
Flow: -999 kcfs
Forecast
Forecast not available for this location.
| Time | Stage (ft) | Flow (kcfs) |
|---|---|---|
| 6:30 PM 12/6 | 3.7 | -999 |
| 6:15 PM 12/6 | 3.69 | -999 |
| 6:00 PM 12/6 | 3.69 | -999 |
| 5:45 PM 12/6 | 3.69 | -999 |
| 5:30 PM 12/6 | 3.68 | -999 |
| 5:15 PM 12/6 | 3.68 | -999 |
| 5:00 PM 12/6 | 3.67 | -999 |
| 4:45 PM 12/6 | 3.67 | -999 |
| 4:30 PM 12/6 | 3.66 | -999 |
| 4:15 PM 12/6 | 3.65 | -999 |
| 4:00 PM 12/6 | 3.65 | -999 |
| 3:45 PM 12/6 | 3.64 | -999 |
| 3:30 PM 12/6 | 3.63 | -999 |
| 3:15 PM 12/6 | 3.63 | -999 |
| 3:00 PM 12/6 | 3.62 | -999 |
| 2:46 PM 12/6 | 3.62 | -999 |
| 2:45 PM 12/6 | 3.62 | -999 |
| 2:30 PM 12/6 | 3.61 | -999 |
| 2:15 PM 12/6 | 3.61 | -999 |
| 2:00 PM 12/6 | 3.61 | -999 |
| 1:45 PM 12/6 | 3.61 | -999 |
| 1:30 PM 12/6 | 3.61 | -999 |
| 1:15 PM 12/6 | 3.61 | -999 |
| 1:00 PM 12/6 | 3.61 | -999 |
| 12:45 PM 12/6 | 3.61 | -999 |
| 12:30 PM 12/6 | 3.61 | -999 |
| 12:15 PM 12/6 | 3.61 | -999 |
| 12:00 PM 12/6 | 3.61 | -999 |
| 11:45 AM 12/6 | 3.61 | -999 |
| 11:30 AM 12/6 | 3.61 | -999 |
16' -
Widespread flooding is expected along the river. Numerous residences along Main Street along and downstream of the Sutton Street Bridge will experience flooding.
13' -
This is a serious flood event. Flooding will spread into residences along the river on Main Street. Flooding will affect low lying areas from Northbridge to Millville. Buisnesses along the river should take the necessary actions to protect property along the river.
11' -
Flooding is expected along the river from Northbridge through Uxbridge and Millville. Flooding will affect some homes and businesses along the river in these towns.
9' -
Flooding of low lying areas along the river bank is likely between Northbridge and the Rhode Island and Massachusetts border.
| Date | Stage (ft) |
|---|---|
| Aug 20, 1955 | 16.74 |
| Mar 19, 1936 | 13.7 |
| Oct 15, 2005 | 13.65 |
| Jan 25, 1979 | 12.48 |
| Sep 12, 1954 | 11.36 |
| Mar 19, 1968 | 10.9 |
| Mar 10, 1998 | 10.7 |
| Mar 31, 2010 | 10.69 |
| Sep 8, 2011 | 10.54 |
| Apr 16, 2007 | 10.5 |
| Dec 12, 2008 | 10.5 |
| Sep 2, 2021 | 10.43 |
| Aug 29, 2011 | 10.36 |
| Dec 19, 2023 | 9.78 |
| Oct 16, 1955 | 9.48 |
| Apr 5, 1987 | 9.4 |
| Feb 26, 2010 | 9.4 |
| Feb 4, 1970 | 9.33 |
| Mar 7, 2011 | 9.32 |
| Jun 7, 1982 | 9.3 |
Data provided by the National Weather Service.