Malheur River at Vale
Critical Stages
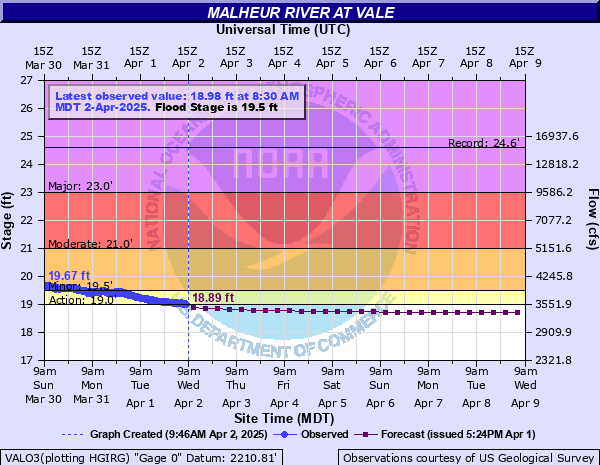
19' - Action
19.5' - Flood
21' - Moderate
23' - Major
Latest Observation
Updated: 9:30 PM MST 12/15/25
Status: No Flooding
Stage: 11.15 ft
Flow: 0.107 kcfs
Forecast
| Time | Stage (ft) | Flow (kcfs) |
|---|---|---|
| 11 PM 12/15 | 11.16 | 0.109 |
| 5 AM 12/16 | 11.17 | 0.111 |
| 11 AM 12/16 | 11.17 | 0.111 |
| 5 PM 12/16 | 11.19 | 0.114 |
| 11 PM 12/16 | 11.22 | 0.119 |
| 5 AM 12/17 | 11.23 | 0.121 |
| 11 AM 12/17 | 11.27 | 0.127 |
| 5 PM 12/17 | 11.35 | 0.142 |
| 11 PM 12/17 | 11.5 | 0.171 |
| 5 AM 12/18 | 11.47 | 0.165 |
| 11 AM 12/18 | 11.47 | 0.165 |
| 5 PM 12/18 | 11.64 | 0.201 |
| 11 PM 12/18 | 12.04 | 0.295 |
| 5 AM 12/19 | 12.66 | 0.462 |
| 11 AM 12/19 | 12.58 | 0.439 |
| 5 PM 12/19 | 12.5 | 0.417 |
| 11 PM 12/19 | 12.5 | 0.417 |
| 5 AM 12/20 | 12.5 | 0.417 |
| 11 AM 12/20 | 12.38 | 0.383 |
| 5 PM 12/20 | 12.24 | 0.346 |
| 11 PM 12/20 | 12.09 | 0.308 |
| 5 AM 12/21 | 11.98 | 0.28 |
| 11 AM 12/21 | 11.89 | 0.258 |
| 5 PM 12/21 | 11.81 | 0.239 |
| 11 PM 12/21 | 11.73 | 0.221 |
| 5 AM 12/22 | 11.69 | 0.212 |
| 11 AM 12/22 | 11.72 | 0.219 |
| 5 PM 12/22 | 11.74 | 0.223 |
| 11 PM 12/22 | 11.84 | 0.246 |
| 5 AM 12/23 | 11.97 | 0.277 |
| 11 AM 12/23 | 12 | 0.285 |
| 5 PM 12/23 | 11.97 | 0.277 |
| 11 PM 12/23 | 11.95 | 0.272 |
| 5 AM 12/24 | 11.88 | 0.255 |
| 11 AM 12/24 | 11.84 | 0.246 |
| 5 PM 12/24 | 11.78 | 0.232 |
| 11 PM 12/24 | 11.73 | 0.221 |
| 5 AM 12/25 | 11.71 | 0.216 |
| Time | Stage (ft) | Flow (kcfs) |
|---|---|---|
| 9:30 PM 12/15 | 11.15 | 0.107 |
| 9:15 PM 12/15 | 11.15 | 0.107 |
| 9:00 PM 12/15 | 11.15 | 0.107 |
| 8:45 PM 12/15 | 11.15 | 0.107 |
| 8:30 PM 12/15 | 11.15 | 0.107 |
| 8:15 PM 12/15 | 11.15 | 0.107 |
| 8:00 PM 12/15 | 11.15 | 0.107 |
| 7:45 PM 12/15 | 11.15 | 0.107 |
| 7:30 PM 12/15 | 11.15 | 0.107 |
| 7:15 PM 12/15 | 11.15 | 0.107 |
| 7:00 PM 12/15 | 11.15 | 0.107 |
| 6:45 PM 12/15 | 11.15 | 0.107 |
| 6:30 PM 12/15 | 11.15 | 0.107 |
| 6:15 PM 12/15 | 11.15 | 0.107 |
| 6:00 PM 12/15 | 11.15 | 0.107 |
| 5:45 PM 12/15 | 11.15 | 0.107 |
| 5:30 PM 12/15 | 11.15 | 0.107 |
| 5:15 PM 12/15 | 11.15 | 0.107 |
| 5:00 PM 12/15 | 11.15 | 0.107 |
| 4:45 PM 12/15 | 11.15 | 0.107 |
| 4:30 PM 12/15 | 11.15 | 0.107 |
| 4:15 PM 12/15 | 11.15 | 0.107 |
| 4:00 PM 12/15 | 11.15 | 0.107 |
| 3:45 PM 12/15 | 11.15 | 0.107 |
| 3:30 PM 12/15 | 11.15 | 0.107 |
| 3:15 PM 12/15 | 11.15 | 0.107 |
| 3:00 PM 12/15 | 11.15 | 0.107 |
| 2:45 PM 12/15 | 11.15 | 0.107 |
| 2:30 PM 12/15 | 11.15 | 0.107 |
| 2:15 PM 12/15 | 11.15 | 0.107 |
24' -
The river level will be about three feet from overtopping the levee which protects the city of Vale from major flooding. Even though there is still approximately three feet between the surface of the river and the top of the levee, any rise above 24 feet will exceed the safe design capacity of the levee. Major flooding of other areas within the 100 year flood plain between Harper and Ontario is likely.
23' -
Water may begin flowing over Highway 20 near Harper. Numerous roads crossing the river between Harper and Ontario will be flooded with water entering houses near the 36th Street Bridge in Ontario. Foothill and Lagoon Drive near Vale may flood if Willow Creek is running high. Extensive inundation of farmland will occur between Harper and Ontario.
22' -
Extensive flooding of farmland between Harper and Ontario will occur. Numerous roads near the river will be flooded including Harper Bridge Road near Harper, Butte Drive between Vale and Ontario, and the 36th Street Bridge area just upstream from Ontario including Malheur Drive. Some houses may be surrounded by water. The river crest will take about 12 hours to move downstream from Harper to Vale, and another 8 hours to move from Vale to Ontario.
21' -
Flood waters will rise above low spots on Copeland Road near Harper. Butte Drive will be flooded with water greater than 1 foot deep between the bridge and Foothill Drive. The area near the 36th Street Bridge upstream from Ontario will flood with water flowing over low spots on Malheur Drive. Debris damming on the 36th Street Bridge may be a problem. Water may cover portions of Airport Road and Russel Road southwest of Vale when Bully Creek is running high.
20.5' -
Flooding of some county roads near the river will occur, including Westfall Road near Harper.
19.5' -
The river will begin spilling over its bank flooding farmland between Vale and Ontario. Water will begin approaching low spots on Butte Drive. Water will approach the 36th Street Bridge upstream from Ontario about 8 hours after flood stage is exceeded near Vale.
| Date | Stage (ft) |
|---|---|
| Feb 24, 1957 | 24.58 |
| Feb 22, 1982 | 23.8 |
| Feb 25, 2025 | 23.55 |
| Mar 19, 1993 | 23.31 |
| Jan 18, 2011 | 22.58 |
| Jan 1, 2006 | 22.05 |
| Apr 12, 2023 | 21.56 |
| Feb 22, 2017 | 21.23 |
| Mar 26, 1952 | 21.23 |
| Mar 5, 1983 | 21.09 |
| Jan 3, 1997 | 20.46 |
| Feb 8, 1951 | 20.06 |
| Feb 9, 1996 | 18.59 |
| Jan 9, 1996 | 18.59 |
| Feb 16, 2016 | 18.56 |
| Mar 2, 1999 | 18.44 |
| Feb 13, 2014 | 17.84 |
| Sep 4, 2013 | 17.37 |
| Mar 25, 2019 | 16.45 |
| Apr 16, 2024 | 15.99 |
Data provided by the National Weather Service.