Clinton River near Clinton Township
Critical Stages
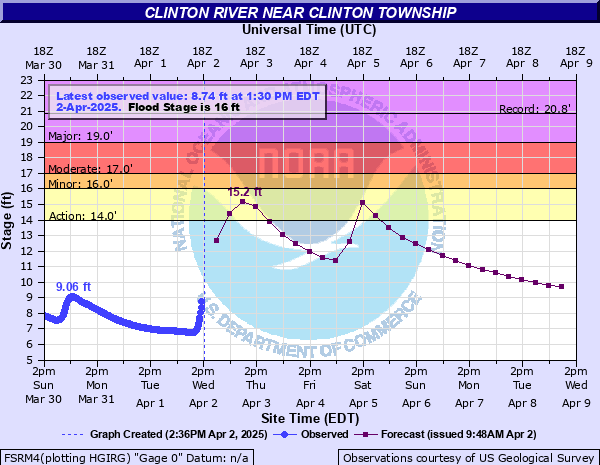
14' - Action
16' - Flood
17' - Moderate
19' - Major
Latest Observation
Updated: 3:30 AM EST 12/5/25
Status: No Flooding
Stage: 6.28 ft
Flow: 0.223 kcfs
Forecast
Forecast not available for this location.
| Time | Stage (ft) | Flow (kcfs) |
|---|---|---|
| 3:30 AM 12/5 | 6.28 | 0.223 |
| 3:15 AM 12/5 | 6.28 | 0.223 |
| 3:00 AM 12/5 | 6.28 | 0.223 |
| 2:45 AM 12/5 | 6.28 | 0.223 |
| 2:30 AM 12/5 | 6.28 | 0.223 |
| 2:15 AM 12/5 | 6.28 | 0.223 |
| 2:00 AM 12/5 | 6.28 | 0.223 |
| 1:45 AM 12/5 | 6.28 | 0.223 |
| 1:30 AM 12/5 | 6.28 | 0.223 |
| 1:15 AM 12/5 | 6.28 | 0.223 |
| 1:00 AM 12/5 | 6.28 | 0.223 |
| 12:45 AM 12/5 | 6.28 | 0.223 |
| 12:30 AM 12/5 | 6.28 | 0.223 |
| 12:15 AM 12/5 | 6.28 | 0.223 |
| 12:00 AM 12/5 | 6.28 | 0.223 |
| 11:45 PM 12/4 | 6.28 | 0.223 |
| 11:30 PM 12/4 | 6.28 | 0.223 |
| 11:15 PM 12/4 | 6.28 | 0.223 |
| 11:00 PM 12/4 | 6.28 | 0.223 |
| 10:45 PM 12/4 | 6.28 | 0.223 |
| 10:30 PM 12/4 | 6.28 | 0.223 |
| 10:15 PM 12/4 | 6.28 | 0.223 |
| 10:00 PM 12/4 | 6.28 | 0.223 |
| 9:45 PM 12/4 | 6.29 | 0.224 |
| 9:30 PM 12/4 | 6.29 | 0.224 |
| 9:15 PM 12/4 | 6.29 | 0.224 |
| 9:00 PM 12/4 | 6.29 | 0.224 |
| 8:45 PM 12/4 | 6.29 | 0.224 |
| 8:30 PM 12/4 | 6.29 | 0.224 |
| 8:15 PM 12/4 | 6.29 | 0.224 |
20' -
Extensive overland flooding occurs and the valley becomes covered by water.
19' -
Some houses along Millar Road flood along with local golf courses.
18' -
Water will likely flow over the Garfield, Utica and Hayes Road bridges.
17' -
Water dams up against the Garfield, Utica and Hayes Road bridges, causing the river level on the upstream side of the bridges to be higher than what the river gauge will read downstream.
16' -
Some low spots on Millar Road flood. Water reaches the bottoms of the Garfield, Uitca and Hayes Road bridges. Low land flooding increases.
13' -
Some low lands adjacent to the river flood.
| Date | Stage (ft) |
|---|---|
| Aug 12, 2014 | 20.84 |
| Apr 5, 1947 | 20 |
| Oct 1, 1981 | 19.56 |
| May 11, 1948 | 19.5 |
| Jun 26, 1968 | 18.7 |
| May 26, 2011 | 18.46 |
| Sep 15, 2008 | 18.32 |
| Jul 29, 1976 | 18 |
| May 24, 2004 | 17.93 |
| Feb 18, 1998 | 17.83 |
| Jan 11, 2020 | 17.83 |
| Nov 29, 2011 | 17.66 |
| Aug 25, 2023 | 17.57 |
| Feb 22, 1990 | 17.48 |
| Jan 26, 2024 | 17.39 |
| Feb 23, 1985 | 17.3 |
| Jun 26, 2021 | 17.2 |
| May 26, 1991 | 17.15 |
| Mar 9, 2009 | 16.92 |
| May 19, 1997 | 16.92 |
Data provided by the National Weather Service.