N. Br. Clinton River near Mount Clemens
Critical Stages
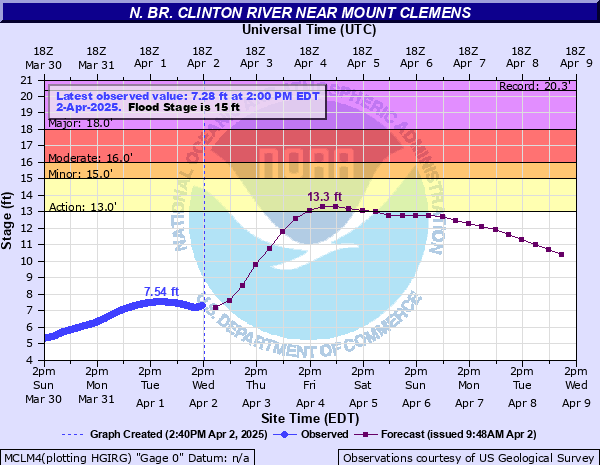
13' - Action
15' - Flood
16' - Moderate
18' - Major
Latest Observation
Updated: 4:00 AM EST 12/5/25
Status: No Flooding
Stage: 4.59 ft
Flow: 0.0351 kcfs
Forecast
Forecast not available for this location.
| Time | Stage (ft) | Flow (kcfs) |
|---|---|---|
| 4:00 AM 12/5 | 4.59 | 0.0351 |
| 3:45 AM 12/5 | 4.58 | 0.0343 |
| 3:30 AM 12/5 | 4.58 | 0.0343 |
| 3:15 AM 12/5 | 4.58 | 0.0343 |
| 3:00 AM 12/5 | 4.58 | 0.0343 |
| 2:45 AM 12/5 | 4.57 | 0.0334 |
| 2:30 AM 12/5 | 4.57 | 0.0334 |
| 2:15 AM 12/5 | 4.57 | 0.0334 |
| 2:00 AM 12/5 | 4.57 | 0.0334 |
| 1:45 AM 12/5 | 4.56 | 0.0326 |
| 1:30 AM 12/5 | 4.56 | 0.0326 |
| 1:15 AM 12/5 | 4.56 | 0.0326 |
| 1:00 AM 12/5 | 4.56 | 0.0326 |
| 12:45 AM 12/5 | 4.55 | 0.0318 |
| 12:30 AM 12/5 | 4.55 | 0.0318 |
| 12:15 AM 12/5 | 4.55 | 0.0318 |
| 12:00 AM 12/5 | 4.55 | 0.0318 |
| 11:45 PM 12/4 | 4.55 | 0.0318 |
| 11:30 PM 12/4 | 4.55 | 0.0318 |
| 11:15 PM 12/4 | 4.54 | 0.031 |
| 11:00 PM 12/4 | 4.54 | 0.031 |
| 10:45 PM 12/4 | 4.54 | 0.031 |
| 10:30 PM 12/4 | 4.54 | 0.031 |
| 10:15 PM 12/4 | 4.54 | 0.031 |
| 10:00 PM 12/4 | 4.53 | 0.0302 |
| 9:45 PM 12/4 | 4.53 | 0.0302 |
| 9:30 PM 12/4 | 4.53 | 0.0302 |
| 9:15 PM 12/4 | 4.53 | 0.0302 |
| 9:00 PM 12/4 | 4.53 | 0.0302 |
| 8:45 PM 12/4 | 4.52 | 0.0295 |
20' -
Some residential areas flood.
18' -
Many roads and several golf courses will flood.
16' -
Some structures will start to be affected.
15' -
Agricultural land along the river begins to flood. When the river reaches this level due to rain, the Middle Branch Clinton River usually is flooding in some locations. The middle branch will crest about 24 hours earlier than the north branch. 21 and 22 Mile Roads may be flooded. Water could also reach the foundation of a few homes along the bank of the middle branch by Heyndrich and Cass Avenue.
13' -
River reaches bankfull with only wooded areas flooding.
| Date | Stage (ft) |
|---|---|
| May 24, 2004 | 20.34 |
| Apr 5, 1947 | 20 |
| Feb 2, 1968 | 18.62 |
| Apr 20, 1975 | 18.48 |
| Feb 10, 2001 | 17.7 |
| Feb 25, 1985 | 17.54 |
| Feb 13, 2009 | 17.27 |
| Mar 13, 1962 | 17.2 |
| Feb 22, 2018 | 17.03 |
| Mar 5, 1974 | 16.93 |
| Feb 11, 1965 | 16.3 |
| Sep 16, 2008 | 16.16 |
| Jan 13, 2020 | 16 |
| Aug 26, 2023 | 15.94 |
| Mar 15, 1982 | 15.82 |
| Sep 7, 1985 | 15.58 |
| Dec 29, 2008 | 15.46 |
| Feb 18, 1976 | 15.34 |
| Aug 11, 2009 | 15.27 |
| Mar 11, 1986 | 15.23 |
Data provided by the National Weather Service.