Crow Creek at 19th Street Cheyenne
Critical Stages
7' - Action
8' - Flood
Moderate
Major
Latest Observation
Updated: 10:15 AM MST 12/15/25
Status: No Flooding
Stage: 1.62 ft
Flow: 0.0043 kcfs
Forecast
Forecast not available for this location.
| Time | Stage (ft) | Flow (kcfs) |
|---|---|---|
| 11:15 AM 12/15 | 1.62 | 0.0043 |
| 11:00 AM 12/15 | 1.62 | 0.0043 |
| 10:45 AM 12/15 | 1.62 | 0.0043 |
| 10:30 AM 12/15 | 1.62 | 0.0043 |
| 10:15 AM 12/15 | 1.62 | 0.0043 |
| 10:00 AM 12/15 | 1.62 | 0.0043 |
| 9:45 AM 12/15 | 1.63 | 0.0045 |
| 9:30 AM 12/15 | 1.63 | 0.0045 |
| 9:15 AM 12/15 | 1.63 | 0.0045 |
| 9:00 AM 12/15 | 1.63 | 0.0045 |
| 8:45 AM 12/15 | 1.63 | 0.0045 |
| 8:30 AM 12/15 | 1.63 | 0.0045 |
| 8:15 AM 12/15 | 1.64 | 0.0047 |
| 8:00 AM 12/15 | 1.65 | 0.0049 |
| 7:45 AM 12/15 | 1.66 | 0.0051 |
| 7:30 AM 12/15 | 1.68 | 0.0055 |
| 7:15 AM 12/15 | 1.7 | 0.006 |
| 7:00 AM 12/15 | 1.7 | 0.006 |
| 6:45 AM 12/15 | 1.69 | 0.0058 |
| 6:30 AM 12/15 | 1.67 | 0.0053 |
| 6:15 AM 12/15 | 1.62 | 0.0043 |
| 6:00 AM 12/15 | 1.62 | 0.0043 |
| 5:45 AM 12/15 | 1.62 | 0.0043 |
| 5:30 AM 12/15 | 1.62 | 0.0043 |
| 5:15 AM 12/15 | 1.62 | 0.0043 |
| 5:00 AM 12/15 | 1.62 | 0.0043 |
| 4:45 AM 12/15 | 1.62 | 0.0043 |
| 4:30 AM 12/15 | 1.62 | 0.0043 |
| 4:15 AM 12/15 | 1.61 | 0.0042 |
| 4:00 AM 12/15 | 1.61 | 0.0042 |
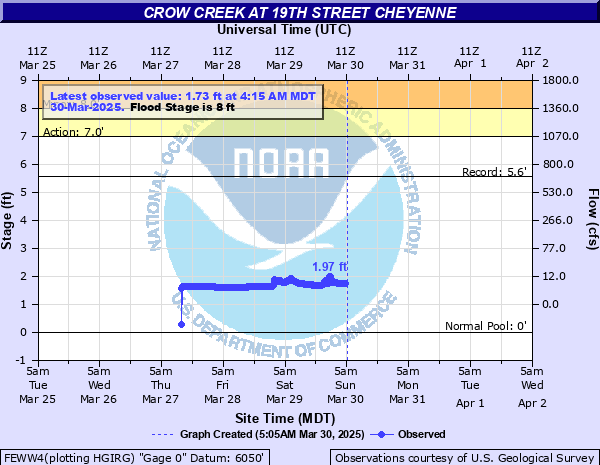
8' -
Flood stage. Access to the gravel plant road on the left creek bank near the gage will become impassable. The wetlands viewing area at Martin Luther King Park 1/4 mile downstream on the left creek bank will be under water. The Ames Avenue underpass will be under water.
7' -
Bankfull stage. Water along low lying areas on the left creek bank to include the gravel plant road and the wetlands viewing area at Martin Luther King Park. Water approaches the Ames Avenue underpass.
5.56' -
Record stage established on April 30 1999.
4.9' -
Record flow of 769 cfs established on August 12 1997.
| Date | Stage (ft) |
|---|---|
| Apr 30, 1999 | 5.56 |
| May 10, 2016 | 4.81 |
| Aug 12, 1997 | 4.8 |
| Aug 5, 2008 | 4.73 |
| Aug 14, 2018 | 4.67 |
| May 9, 2015 | 4.44 |
| Jun 6, 2012 | 4.43 |
| Jul 24, 2011 | 4.33 |
| Sep 14, 2013 | 4.3 |
| Jun 14, 2010 | 4.21 |
| Feb 6, 2014 | 4.11 |
| Jul 13, 2014 | 3.8 |
| Jul 2, 1995 | 3.69 |
| Jul 23, 2006 | 3.52 |
| Aug 22, 2007 | 3.45 |
| Aug 29, 1996 | 3.44 |
| Jul 13, 2001 | 3.41 |
| May 22, 1998 | 3.4 |
| Jun 26, 2009 | 3.38 |
| Jun 12, 2005 | 3.33 |
Data provided by the National Weather Service.