« Back to Burgess Reservoir Number 1 Rivers
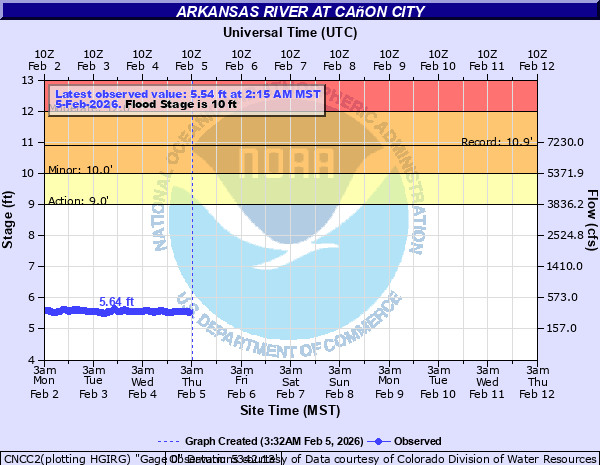
Arkansas River at Cañon City
Critical Stages
9' - Action
10' - Flood
12' - Moderate
14' - Major
Latest Observation
Updated: 5:15 AM MST 12/6/25
Status: No Flooding
Stage: 5.61 ft
Flow: 0.365 kcfs
Forecast
Forecast not available for this location.
| Time | Stage (ft) | Flow (kcfs) |
|---|---|---|
| 5:15 AM 12/6 | 5.61 | 0.365 |
| 5:00 AM 12/6 | 5.61 | 0.365 |
| 4:45 AM 12/6 | 5.61 | 0.365 |
| 4:30 AM 12/6 | 5.61 | 0.365 |
| 4:15 AM 12/6 | 5.61 | 0.365 |
| 4:00 AM 12/6 | 5.61 | 0.365 |
| 3:45 AM 12/6 | 5.61 | 0.365 |
| 3:30 AM 12/6 | 5.61 | 0.365 |
| 3:15 AM 12/6 | 5.61 | 0.365 |
| 3:00 AM 12/6 | 5.61 | 0.365 |
| 2:45 AM 12/6 | 5.62 | 0.37 |
| 2:30 AM 12/6 | 5.62 | 0.37 |
| 2:15 AM 12/6 | 5.63 | 0.375 |
| 2:00 AM 12/6 | 5.63 | 0.375 |
| 1:45 AM 12/6 | 5.63 | 0.375 |
| 1:30 AM 12/6 | 5.64 | 0.379 |
| 1:15 AM 12/6 | 5.64 | 0.379 |
| 1:00 AM 12/6 | 5.64 | 0.379 |
| 12:45 AM 12/6 | 5.65 | 0.384 |
| 12:30 AM 12/6 | 5.65 | 0.384 |
| 12:15 AM 12/6 | 5.65 | 0.384 |
| 12:00 AM 12/6 | 5.66 | 0.389 |
| 11:45 PM 12/5 | 5.66 | 0.389 |
| 11:30 PM 12/5 | 5.66 | 0.389 |
| 11:15 PM 12/5 | 5.67 | 0.394 |
| 11:00 PM 12/5 | 5.67 | 0.394 |
| 10:45 PM 12/5 | 5.68 | 0.399 |
| 10:30 PM 12/5 | 5.68 | 0.399 |
| 10:15 PM 12/5 | 5.68 | 0.399 |
| 10:00 PM 12/5 | 5.69 | 0.404 |
23' -
Flood waters roll over top of 1st Street Bridge
18.5' -
Flood waters reach base of 1st Street Bridge and inundate nearby homes and businesses
18' -
Flood waters inundate numerous homes and power plant in western Canon City
16' -
Water reaches base of 9th Street Bridge and flows into nearby oil distribution complex
15.5' -
Water rises into Royal Gorge Train Depot parking lot
15' -
Flood waters inundate homes and businesses near 4th Street Bridge
14.5' -
Water overtops levee along Riverside Drive flooding nearby homes and businesses
14' -
Major Flood. Basements flood in homes near 9th Street Bridge
13.5' -
Water spills into Centennial Park near 4th Street Bridge
12' -
Moderate Flood. Serious lowland and meadow flooding occurs
10' -
Minor flood. Minor overbank flow occurs into low lying areas along river. Water overtops screens at Canon City water supply intake
8' -
The river is bankfull
| Date | Stage (ft) |
|---|---|
| Jun 18, 1995 | 10.9 |
| Jun 18, 2019 | 10.56 |
| Jun 21, 2015 | 10.42 |
| Jun 27, 1983 | 10.08 |
| Jun 12, 1980 | 10.05 |
| Jun 10, 2024 | 10.02 |
| Jun 7, 2010 | 9.8 |
| Jun 21, 1997 | 9.78 |
| Jun 14, 1996 | 9.52 |
| May 26, 1984 | 9.48 |
| Jun 10, 1987 | 9.4 |
| Jun 20, 2008 | 9.39 |
| Jun 20, 2017 | 9.27 |
| Jun 2, 1994 | 9.2 |
| Jun 25, 1999 | 9.07 |
| Jul 2, 2011 | 9 |
| May 31, 2003 | 8.99 |
| Jul 8, 1998 | 8.95 |
| Jun 11, 1990 | 8.47 |
| Jul 24, 1965 | 8.28 |
Data provided by the National Weather Service.