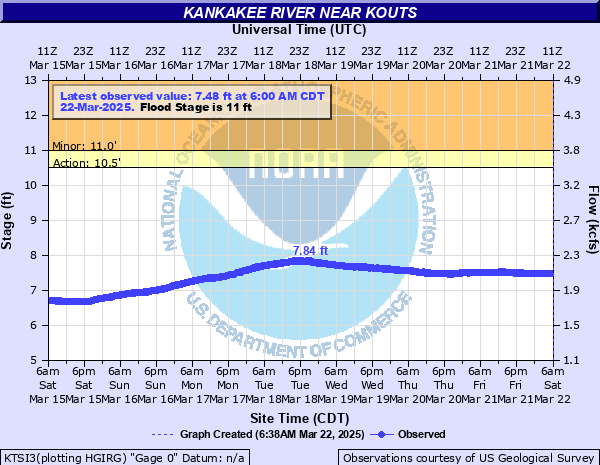
Kankakee River near Kouts
Critical Stages
10.5' - Action
11' - Flood
13' - Moderate
14' - Major
Latest Observation
Updated: 9:00 AM CST 12/14/25
Status: No Flooding
Stage: 4.97 ft
Flow: 1.1 kcfs
Forecast
Forecast not available for this location.
| Time | Stage (ft) | Flow (kcfs) |
|---|---|---|
| 9:00 AM 12/14 | 4.97 | 1.1 |
| 8:45 AM 12/14 | 4.97 | 1.1 |
| 8:30 AM 12/14 | 4.98 | 1.1 |
| 8:15 AM 12/14 | 4.97 | 1.1 |
| 8:00 AM 12/14 | 4.96 | 1.1 |
| 7:45 AM 12/14 | 4.97 | 1.1 |
| 7:30 AM 12/14 | 4.98 | 1.1 |
| 7:15 AM 12/14 | 5 | 1.11 |
| 7:00 AM 12/14 | 5 | 1.11 |
| 6:45 AM 12/14 | 4.99 | 1.11 |
| 6:30 AM 12/14 | 5.01 | 1.12 |
| 6:15 AM 12/14 | 5.01 | 1.12 |
| 6:00 AM 12/14 | 5.03 | 1.12 |
| 5:45 AM 12/14 | 5.02 | 1.12 |
| 5:30 AM 12/14 | 5.04 | 1.13 |
| 5:15 AM 12/14 | 5.03 | 1.12 |
| 5:00 AM 12/14 | 5.04 | 1.13 |
| 4:45 AM 12/14 | 5.05 | 1.13 |
| 4:30 AM 12/14 | 5.05 | 1.13 |
| 4:15 AM 12/14 | 5.06 | 1.13 |
| 4:00 AM 12/14 | 5.07 | 1.14 |
| 3:45 AM 12/14 | 5.06 | 1.13 |
| 3:30 AM 12/14 | 5.08 | 1.14 |
| 3:15 AM 12/14 | 5.08 | 1.14 |
| 3:00 AM 12/14 | 5.09 | 1.14 |
| 2:45 AM 12/14 | 5.1 | 1.15 |
| 2:30 AM 12/14 | 5.09 | 1.14 |
| 2:15 AM 12/14 | 5.11 | 1.15 |
| 2:00 AM 12/14 | 5.11 | 1.15 |
| 1:45 AM 12/14 | 5.12 | 1.15 |
17' -
Numerous structures and roads are inundated in northwest sections of De Motte.
16' -
Widespread inundation of the floodplain reaches up to 4 miles from the river.
15' -
IN-49 threatened south of the river. US-231 threatened north of the river.
14.5' -
Residences threatened along 125 West Road/Baums Bridge Road near the river.
14' -
Structures threatened along 625 West Road and 700 West Road near the river. Structures threatened near 400 West Road and 250 West Road and the river. A few structures threatened northwest of De Motte.
13.5' -
125 West Road/Baums Bridge Road threatened near the river.
13' -
Structures threatened near IN-49 and the river. Backwater on a drainage canal threatens 1200 South Road east of IN-49. Widespread inundation of the floodplain reaches up to 3 miles from the river.
11' -
Low-lying agricultural land is inundated near the river.
10' -
Water overflows low-lying banks along the river.
| Date | Stage (ft) |
|---|---|
| Mar 24, 1982 | 14.52 |
| Feb 26, 2018 | 14.46 |
| Mar 14, 2009 | 14.02 |
| Mar 5, 1985 | 13.98 |
| Jul 24, 1996 | 13.75 |
| Jan 10, 1994 | 13.74 |
| Jan 8, 1993 | 13.73 |
| Sep 17, 2008 | 13.59 |
| Mar 1, 1997 | 13.48 |
| Jan 17, 2005 | 13.32 |
| Jan 13, 1978 | 13.29 |
| May 3, 2011 | 13.19 |
| Jan 13, 1998 | 13.1 |
| Oct 22, 1993 | 12.86 |
| Apr 29, 1999 | 12.85 |
| May 18, 2002 | 12.84 |
| Jun 21, 2015 | 12.65 |
| Mar 6, 1976 | 12.49 |
| Feb 16, 2001 | 12.29 |
| May 6, 2019 | 12.19 |
Data provided by the National Weather Service.