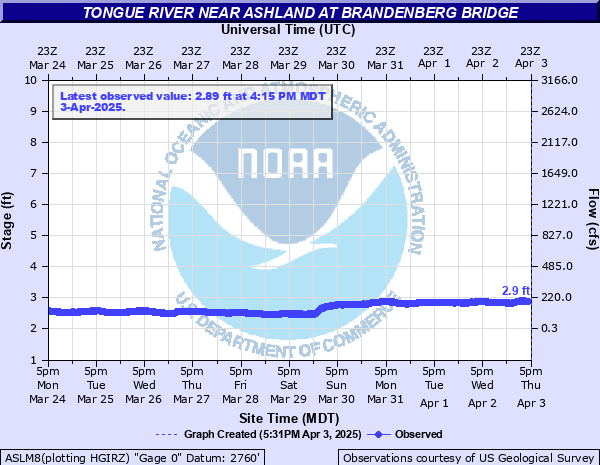
Tongue River near Ashland at Brandenberg Bridge
Critical Stages
Action
Flood
Moderate
Major
Latest Observation
Updated: 11:15 PM MST 12/17/25
Status: Not Defined
Stage: 3.86 ft
Flow: 0.441 kcfs
Forecast
Forecast not available for this location.
| Time | Stage (ft) | Flow (kcfs) |
|---|---|---|
| 11:15 PM 12/17 | 3.86 | 0.441 |
| 11:00 PM 12/17 | 3.86 | 0.441 |
| 10:45 PM 12/17 | 3.86 | 0.441 |
| 10:30 PM 12/17 | 3.85 | 0.438 |
| 10:15 PM 12/17 | 3.85 | 0.438 |
| 10:00 PM 12/17 | 3.84 | 0.436 |
| 9:45 PM 12/17 | 3.84 | 0.436 |
| 9:30 PM 12/17 | 3.85 | 0.438 |
| 9:15 PM 12/17 | 3.84 | 0.436 |
| 9:00 PM 12/17 | 3.83 | 0.433 |
| 8:45 PM 12/17 | 3.83 | 0.433 |
| 8:30 PM 12/17 | 3.83 | 0.433 |
| 8:15 PM 12/17 | 3.83 | 0.433 |
| 8:00 PM 12/17 | 3.83 | 0.433 |
| 7:45 PM 12/17 | 3.84 | 0.436 |
| 7:30 PM 12/17 | 3.85 | 0.438 |
| 7:15 PM 12/17 | 3.85 | 0.438 |
| 7:00 PM 12/17 | 3.85 | 0.438 |
| 6:45 PM 12/17 | 3.84 | 0.436 |
| 6:30 PM 12/17 | 3.83 | 0.433 |
| 6:15 PM 12/17 | 3.82 | 0.43 |
| 6:00 PM 12/17 | 3.81 | 0.428 |
| 5:45 PM 12/17 | 3.8 | 0.425 |
| 5:30 PM 12/17 | 3.8 | 0.425 |
| 5:15 PM 12/17 | 3.82 | 0.43 |
| 5:00 PM 12/17 | 3.83 | 0.433 |
| 4:45 PM 12/17 | 3.83 | 0.433 |
| 4:30 PM 12/17 | 3.85 | 0.438 |
| 4:15 PM 12/17 | 3.86 | 0.441 |
| 4:00 PM 12/17 | 3.86 | 0.441 |
No flood impact data available for this location.
| Date | Stage (ft) |
|---|---|
| Jun 2, 2019 | 11.65 |
| Mar 15, 2003 | 11.49 |
| Jun 11, 2007 | 10.97 |
| Jun 2, 2018 | 10.64 |
| Jun 4, 2014 | 10.31 |
| Jun 14, 2023 | 10.26 |
| Jun 7, 2015 | 10.17 |
| May 22, 1978 | 9.96 |
| May 21, 2017 | 9.47 |
| May 25, 2005 | 8.85 |
| Jun 16, 2022 | 8.77 |
| Jun 13, 2024 | 8.55 |
| Jun 8, 2006 | 7.87 |
| Jun 28, 1975 | 6.65 |
| Jun 3, 2020 | 6.41 |
| Jun 9, 2021 | 6.25 |
| Jun 30, 2001 | 6 |
| May 19, 1977 | 5.85 |
| Jun 16, 1983 | 5.82 |
| Jun 13, 1981 | 5.75 |
Data provided by the National Weather Service.