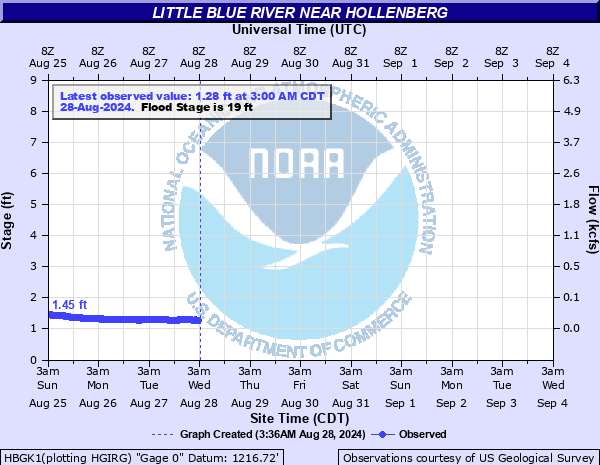
Little Blue River near Hollenberg
Critical Stages
15' - Action
19' - Flood
19.4' - Moderate
45' - Major
Latest Observation
Updated: 6:00 PM CST 12/15/25
Status: No Flooding
Stage: 1.82 ft
Flow: -999 kcfs
Forecast
Forecast not available for this location.
| Time | Stage (ft) | Flow (kcfs) |
|---|---|---|
| 6:00 PM 12/15 | 1.82 | -999 |
| 5:45 PM 12/15 | 1.83 | -999 |
| 5:30 PM 12/15 | 1.83 | -999 |
| 5:15 PM 12/15 | 1.83 | -999 |
| 5:00 PM 12/15 | 1.81 | -999 |
| 4:45 PM 12/15 | 1.8 | -999 |
| 4:30 PM 12/15 | 1.79 | -999 |
| 4:15 PM 12/15 | 1.81 | -999 |
| 4:00 PM 12/15 | 1.79 | -999 |
| 3:45 PM 12/15 | 1.78 | -999 |
| 3:30 PM 12/15 | 1.76 | -999 |
| 3:15 PM 12/15 | 1.75 | -999 |
| 3:00 PM 12/15 | 1.75 | -999 |
| 2:45 PM 12/15 | 1.77 | -999 |
| 2:30 PM 12/15 | 1.77 | -999 |
| 2:15 PM 12/15 | 1.8 | -999 |
| 2:00 PM 12/15 | 1.83 | -999 |
| 1:45 PM 12/15 | 1.88 | -999 |
| 1:30 PM 12/15 | 1.91 | -999 |
| 1:15 PM 12/15 | 1.94 | -999 |
| 1:00 PM 12/15 | 1.97 | -999 |
| 12:45 PM 12/15 | 2.01 | 0.149 |
| 12:30 PM 12/15 | 2.04 | 0.159 |
| 12:15 PM 12/15 | 2.05 | 0.162 |
| 12:00 PM 12/15 | 2.06 | 0.166 |
| 11:45 AM 12/15 | 2.06 | 0.166 |
| 11:30 AM 12/15 | 2.03 | 0.156 |
| 11:15 AM 12/15 | 1.98 | -999 |
| 11:00 AM 12/15 | 1.95 | -999 |
| 10:45 AM 12/15 | 1.93 | -999 |
44.3' -
Railroad tracks on the west side of Hollenberg flood.
35.5' -
Hollenberg Avenue bridge floods.
31.34' -
Bridge deck floods on east end of bridge.
27.7' -
Flood waters reach low steel of Hollenberg Avenue bridge on upstream side of bridge.
23.83' -
Thunder Road floods about 200 yards south of Hollenberg Avenue.
20.83' -
Right bank floods just south of the Hollenberg Avenue bridge.
19.39' -
Hollenberg avenue floods about a quarter mile west of the railroad tracks.
19' -
Flood waters reach the edge of hollenberg avenue about a quarter mile west of the railroad tracks. Farm fields west of hollenberg are under 2 to 5 feet of water.
| Date | Stage (ft) |
|---|---|
| Oct 12, 1973 | 23.07 |
| May 7, 2015 | 22.97 |
| Jul 26, 1992 | 21.209999084473 |
| Jun 13, 1984 | 21 |
| Jun 24, 2003 | 20.67 |
| Mar 25, 1987 | 19.280000686646 |
| Jul 27, 1993 | 18.120000839233 |
| Mar 22, 1978 | 16.579999923706 |
| Sep 30, 1983 | 16.370000839233 |
| Aug 6, 1985 | 16.004999160767 |
| Jul 5, 1982 | 15.85000038147 |
| Jun 15, 1990 | 15.14999961853 |
| Oct 3, 2019 | 15.03 |
| Aug 2, 2007 | 14.81 |
| Mar 14, 2019 | 14.78 |
| Sep 12, 1977 | 14.720000267029 |
| Mar 24, 1979 | 14.409999847412 |
| Jul 18, 2008 | 14.35 |
| May 20, 2017 | 13.81 |
| Apr 28, 1986 | 13.789999961853 |
Data provided by the National Weather Service.