« Back to Calhoun County Rivers
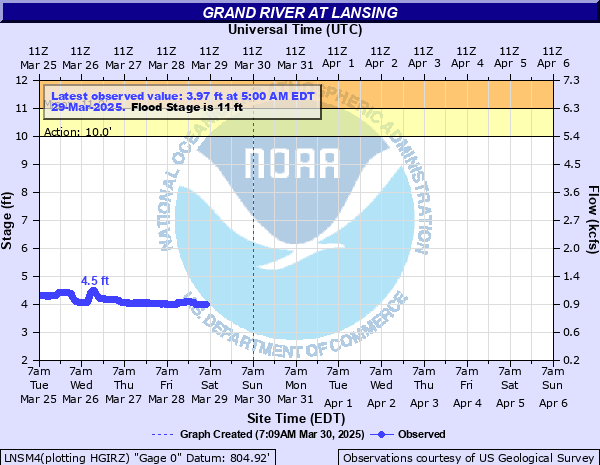
Grand River at Lansing
Critical Stages
10' - Action
11' - Flood
13' - Moderate
15' - Major
Latest Observation
Updated: 12:00 AM EST 12/15/25
Status: No Flooding
Stage: 2.38 ft
Flow: 0.332 kcfs
Forecast
Forecast not available for this location.
| Time | Stage (ft) | Flow (kcfs) |
|---|---|---|
| 12:00 AM 12/15 | 2.38 | 0.332 |
| 11:45 PM 12/14 | 2.38 | 0.332 |
| 11:30 PM 12/14 | 2.35 | 0.317 |
| 11:15 PM 12/14 | 2.4 | 0.342 |
| 11:00 PM 12/14 | 2.42 | 0.352 |
| 10:45 PM 12/14 | 2.45 | 0.368 |
| 10:30 PM 12/14 | 2.44 | 0.363 |
| 10:15 PM 12/14 | 2.45 | 0.368 |
| 10:00 PM 12/14 | 2.44 | 0.363 |
| 9:45 PM 12/14 | 2.45 | 0.368 |
| 9:30 PM 12/14 | 2.44 | 0.363 |
| 9:15 PM 12/14 | 2.42 | 0.352 |
| 9:00 PM 12/14 | 2.43 | 0.358 |
| 8:45 PM 12/14 | 2.42 | 0.352 |
| 8:30 PM 12/14 | 2.42 | 0.352 |
| 8:15 PM 12/14 | 2.42 | 0.352 |
| 8:00 PM 12/14 | 2.4 | 0.342 |
| 7:45 PM 12/14 | 2.38 | 0.332 |
| 7:30 PM 12/14 | 2.39 | 0.337 |
| 7:15 PM 12/14 | 2.38 | 0.332 |
| 7:00 PM 12/14 | 2.35 | 0.317 |
| 6:45 PM 12/14 | 2.35 | 0.317 |
| 6:30 PM 12/14 | 2.31 | 0.299 |
| 6:15 PM 12/14 | 2.3 | 0.294 |
| 6:00 PM 12/14 | 2.29 | 0.289 |
| 5:45 PM 12/14 | 2.29 | 0.289 |
| 5:30 PM 12/14 | 2.3 | 0.294 |
| 5:15 PM 12/14 | 2.3 | 0.294 |
| 5:00 PM 12/14 | 2.3 | 0.294 |
| 4:45 PM 12/14 | 2.3 | 0.294 |
17' -
Expect widespread major flooding of industries, businesses, and residences in the Lansing area.
15.5' -
Expect road closures and major flooding of residences and businesses in North Lansing, in the Cherry Hill neighborhood, Tecumseh River Drive, Willow Street and in Edmore Park area.
15' -
Expect major flooding of homes and businesses in low lying areas adjacent to the river. High water also begins to affect the railroad switch yard.
14' -
Expect moderate flooding of homes along Willow Street, Roosevelt Street and in the Cherry Hill neighborhood along the river.
13.5' -
Expect moderate flooding of residences and businesses along Pennsylvania Avenue at Lindbergh drive and the Potter Creek area.
12' -
Expect minor flooding of basements of businesses in North Lansing.
11' -
Expect minor flooding of low lying areas and parks.
10' -
River is bankfull.
| Date | Stage (ft) |
|---|---|
| Apr 20, 1975 | 15.43 |
| Feb 23, 2018 | 14.62 |
| Feb 26, 1985 | 14.12 |
| Mar 21, 1948 | 13.4 |
| Mar 17, 1982 | 13.4 |
| May 23, 2004 | 12.85 |
| Apr 5, 1950 | 12.66 |
| Jun 29, 1968 | 12.45 |
| Sep 15, 2008 | 12.27 |
| Apr 8, 2017 | 12.25 |
| Apr 1, 1960 | 12.08 |
| Mar 17, 1919 | 12 |
| Mar 10, 1974 | 11.87 |
| Apr 5, 2023 | 11.8 |
| May 1, 1956 | 11.72 |
| May 20, 2020 | 11.72 |
| Feb 12, 2001 | 11.69 |
| Mar 11, 2009 | 11.61 |
| Mar 5, 1976 | 11.54 |
| Mar 22, 1926 | 11.4 |
Data provided by the National Weather Service.