« Back to Cambridge Municipal Rivers
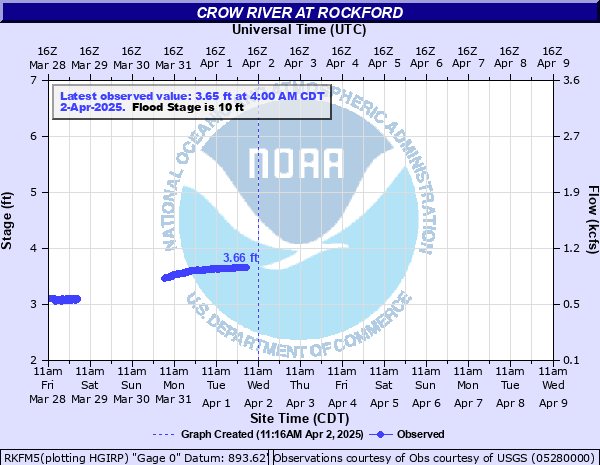
Crow River at Rockford
Critical Stages
8' - Action
10' - Flood
12' - Moderate
14' - Major
Latest Observation
Updated: 2:00 PM CST 12/8/25
Status: No Flooding
Stage: 3.53 ft
Flow: 1.02 kcfs
Forecast
Forecast not available for this location.
| Time | Stage (ft) | Flow (kcfs) |
|---|---|---|
| 2:00 PM 12/8 | 3.53 | 1.02 |
| 1:45 PM 12/8 | 3.54 | 1.03 |
| 1:30 PM 12/8 | 3.52 | 1.01 |
| 1:15 PM 12/8 | 3.53 | 1.02 |
| 1:00 PM 12/8 | 3.52 | 1.01 |
| 12:45 PM 12/8 | 3.53 | 1.02 |
| 12:30 PM 12/8 | 3.54 | 1.03 |
| 12:15 PM 12/8 | 3.56 | 1.04 |
| 12:00 PM 12/8 | 3.59 | 1.06 |
| 11:45 AM 12/8 | 3.59 | 1.06 |
| 11:30 AM 12/8 | 3.58 | 1.06 |
| 11:15 AM 12/8 | 3.57 | 1.05 |
| 11:00 AM 12/8 | 3.6 | 1.07 |
| 10:45 AM 12/8 | 4.7 | 1.94 |
| 10:30 AM 12/8 | 4.02 | 1.4 |
| 10:15 AM 12/8 | 4.67 | 1.91 |
| 10:00 AM 12/8 | 3.78 | 1.21 |
| 9:45 AM 12/8 | 3.81 | 1.23 |
| 9:30 AM 12/8 | 3.82 | 1.24 |
| 9:15 AM 12/8 | 4.18 | 1.53 |
| 9:00 AM 12/8 | 3.85 | 1.26 |
| 8:45 AM 12/8 | 4.09 | 1.46 |
| 8:30 AM 12/8 | 4.14 | 1.49 |
| 8:15 AM 12/8 | 3.81 | 1.23 |
| 8:00 AM 12/8 | 3.78 | 1.21 |
| 7:45 AM 12/8 | 3.93 | 1.33 |
| 7:30 AM 12/8 | 3.82 | 1.24 |
| 7:15 AM 12/8 | 3.9 | 1.31 |
| 7:00 AM 12/8 | 3.91 | 1.31 |
| 6:45 AM 12/8 | 3.9 | 1.31 |
19.7' -
The temporary levee constructed prior to a flood in the 1960s
19.39' -
Water reaches the underside low steel of the Hwy 55 bridge
17.2' -
Water reaches the top of the bank on the west side of the river.
15.6' -
Water reaches the underside steel on the Bridge Street bridge.
15' -
Sanitary sewers serving homes closest to river may begin to back up.
10' -
Low lying areas and some roads along the river begin to experience flooding.
| Date | Stage (ft) |
|---|---|
| Apr 16, 1965 | 19.27 |
| Apr 13, 1969 | 16.51 |
| Apr 13, 1952 | 16.24 |
| Jun 26, 1957 | 16.14 |
| Apr 24, 2023 | 15.6 |
| Jun 25, 2014 | 15.08 |
| Apr 30, 2001 | 14.5 |
| Mar 30, 2019 | 14.42 |
| Apr 9, 1997 | 14.37 |
| Jul 1, 2002 | 14 |
| Mar 22, 2010 | 13.99 |
| Apr 10, 2011 | 13.82 |
| Jul 8, 1993 | 13.23 |
| Jun 24, 2024 | 13.2 |
| May 3, 1975 | 12.9 |
| Sep 17, 1991 | 12.26 |
| Apr 16, 1951 | 12.13 |
| Mar 29, 1982 | 11.9 |
| Apr 5, 1979 | 11.88 |
| Jun 29, 2013 | 11.31 |
Data provided by the National Weather Service.