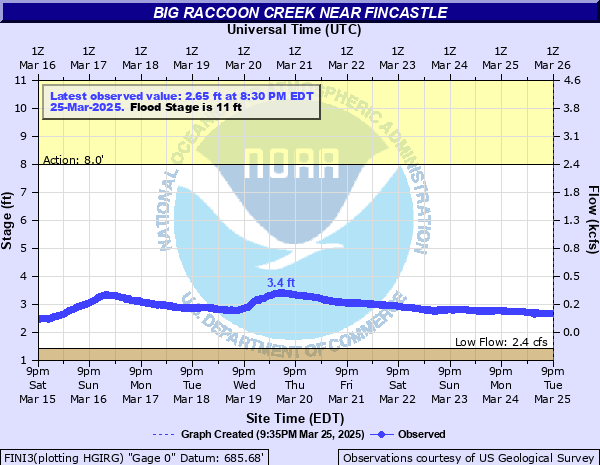
Big Raccoon Creek near Fincastle
Critical Stages
8' - Action
11' - Flood
14' - Moderate
18' - Major
Latest Observation
Updated: 2:30 AM EST 12/10/25
Status: No Flooding
Stage: 3.01 ft
Flow: 0.195 kcfs
Forecast
Forecast not available for this location.
| Time | Stage (ft) | Flow (kcfs) |
|---|---|---|
| 2:30 AM 12/10 | 3.01 | 0.195 |
| 2:15 AM 12/10 | 3.02 | 0.197 |
| 2:00 AM 12/10 | 3.02 | 0.197 |
| 1:30 AM 12/10 | 3.02 | 0.197 |
| 1:15 AM 12/10 | 3.02 | 0.197 |
| 1:00 AM 12/10 | 3.02 | 0.197 |
| 12:30 AM 12/10 | 3.02 | 0.197 |
| 12:15 AM 12/10 | 3.02 | 0.197 |
| 12:00 AM 12/10 | 3.02 | 0.197 |
| 11:30 PM 12/9 | 3.02 | 0.197 |
| 11:15 PM 12/9 | 3.02 | 0.197 |
| 11:00 PM 12/9 | 3.02 | 0.197 |
| 10:30 PM 12/9 | 3.02 | 0.197 |
| 10:15 PM 12/9 | 3.02 | 0.197 |
| 10:00 PM 12/9 | 3.02 | 0.197 |
| 9:30 PM 12/9 | 3.02 | 0.197 |
| 9:15 PM 12/9 | 3.02 | 0.197 |
| 9:00 PM 12/9 | 3.02 | 0.197 |
| 8:30 PM 12/9 | 3.01 | 0.195 |
| 8:15 PM 12/9 | 3.01 | 0.195 |
| 8:00 PM 12/9 | 3.01 | 0.195 |
| 7:30 PM 12/9 | 3.01 | 0.195 |
| 7:15 PM 12/9 | 3.01 | 0.195 |
| 7:00 PM 12/9 | 3.01 | 0.195 |
| 6:30 PM 12/9 | 3.01 | 0.195 |
| 6:15 PM 12/9 | 3.01 | 0.195 |
| 6:00 PM 12/9 | 3.01 | 0.195 |
| 5:30 PM 12/9 | 3.01 | 0.195 |
| 5:15 PM 12/9 | 3.01 | 0.195 |
| 5:00 PM 12/9 | 3.01 | 0.195 |
19.1' -
Record flooding is in progress. County roads along Big Raccoon Creek are flooded by several feet. Flood waters near U.S. Highway 231 and SR 236 west of U.S. Highway 231.
18' -
Major flooding along Big Raccoon Creek. Most local roads along Big Raccoon Creek are flooded.
16' -
Higher portions of county road that runs parallel to the right bank in the vicinity of the gage site begins to overflow.
14' -
Extensive flooding blocks road. Access to gage by boat or high ground. Flooding causes plenty of problems.
13' -
County road floods on both sides of gage.
11' -
Lowland flooding in progress along portions of Big Raccoon Creek.
9' -
Low portions of county road in gage vicinity begins to flood.
8' -
Bankfull conditions along Big Raccoon Creek.
| Date | Stage (ft) |
|---|---|
| Jun 28, 1957 | 19.1 |
| Apr 19, 2013 | 17.24 |
| Feb 28, 2011 | 16.45 |
| Dec 30, 1990 | 16.1 |
| Jun 7, 2008 | 16.08 |
| Jun 4, 2008 | 15.76 |
| May 26, 1989 | 15.48 |
| Jan 26, 1962 | 15.42 |
| Nov 13, 1992 | 15.34 |
| Apr 21, 1964 | 15.15 |
| Jun 19, 2015 | 14.98 |
| Jul 21, 1989 | 14.95 |
| Dec 11, 1985 | 14.89 |
| Dec 22, 1967 | 14.75 |
| Feb 27, 1997 | 14.7 |
| Nov 15, 1993 | 14.59 |
| Nov 20, 1985 | 14.22 |
| Jun 23, 1974 | 14.13 |
| Mar 5, 1963 | 14.03 |
| Feb 12, 2009 | 13.99 |
Data provided by the National Weather Service.