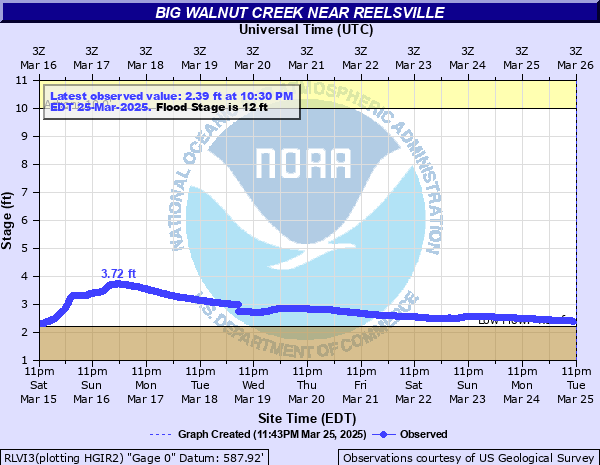
Big Walnut Creek (IN) near Reelsville
Critical Stages
10' - Action
12' - Flood
15' - Moderate
18' - Major
Latest Observation
Updated: 2:30 AM EST 12/10/25
Status: No Flooding
Stage: 1.08 ft
Flow: -999 kcfs
Forecast
Forecast not available for this location.
| Time | Stage (ft) | Flow (kcfs) |
|---|---|---|
| 3:30 AM 12/10 | 1.09 | -999 |
| 3:15 AM 12/10 | 1.1 | -999 |
| 3:00 AM 12/10 | 1.1 | -999 |
| 2:45 AM 12/10 | 1.05 | -999 |
| 2:30 AM 12/10 | 1.08 | -999 |
| 2:15 AM 12/10 | 1.06 | -999 |
| 2:00 AM 12/10 | 1.09 | -999 |
| 1:45 AM 12/10 | 1.09 | -999 |
| 1:30 AM 12/10 | 1.07 | -999 |
| 1:15 AM 12/10 | 1.1 | -999 |
| 1:00 AM 12/10 | 1.08 | -999 |
| 12:45 AM 12/10 | 1.11 | -999 |
| 12:30 AM 12/10 | 1.11 | -999 |
| 12:15 AM 12/10 | 1.09 | -999 |
| 12:00 AM 12/10 | 1.11 | -999 |
| 11:45 PM 12/9 | 1.11 | -999 |
| 11:30 PM 12/9 | 1.11 | -999 |
| 11:15 PM 12/9 | 1.11 | -999 |
| 11:00 PM 12/9 | 1.09 | -999 |
| 10:45 PM 12/9 | 1.1 | -999 |
| 10:30 PM 12/9 | 1.11 | -999 |
| 10:15 PM 12/9 | 1.11 | -999 |
| 10:00 PM 12/9 | 1.11 | -999 |
| 9:45 PM 12/9 | 1.11 | -999 |
| 9:30 PM 12/9 | 1.11 | -999 |
| 9:15 PM 12/9 | 1.11 | -999 |
| 9:00 PM 12/9 | 1.11 | -999 |
| 8:45 PM 12/9 | 1.11 | -999 |
| 8:30 PM 12/9 | 1.11 | -999 |
| 8:15 PM 12/9 | 1.11 | -999 |
19' -
A record flood is in progress. Numerous homes and a few businesses flooded in the Reelsville area. All local roads along Big Walnut Creek are flooded with 2 feet or more of water.
18' -
Major flooding along Big Walnut Creek. All local roads along Big Walnut Creek are flooded.
17' -
Near major flooding along Big Walnut Creek. Local roads along Big Walnut Creek are flooded.
16' -
Extensive flooding is in progress. County road floods at river gaging site. Flood water surrounds several local residences. Most local river roads are flooded or begin to flood.
15' -
Extensive flooding of local roads occurs. Water flows through a gravel pit.
14.5' -
A least one county road is flooded. Agricultural flooding is in progress.
14' -
Flooding of agricultural lands and campgrounds occurs. High water surrounds a few river cabins.
12' -
Flooding begins along portions of Big Walnut Creek.
10' -
Big Walnut Creek at bankfull levels.
| Date | Stage (ft) |
|---|---|
| Jun 28, 1957 | 18.63 |
| Mar 28, 1913 | 18 |
| Jun 22, 1952 | 17.96 |
| Mar 4, 1963 | 17.71 |
| May 8, 1961 | 17.46 |
| Apr 19, 2013 | 17.38 |
| Jan 4, 1950 | 17.33 |
| Jun 23, 1960 | 17.12 |
| May 24, 1968 | 17.07 |
| Dec 30, 1990 | 16.85 |
| Jan 21, 1959 | 16.83 |
| Jun 7, 2008 | 16.79 |
| Dec 20, 1957 | 16.68 |
| Apr 3, 2018 | 16.61 |
| Feb 25, 1956 | 16.6 |
| Mar 21, 1962 | 16.59 |
| Jun 11, 1958 | 16.5 |
| Apr 25, 1961 | 16.47 |
| Feb 10, 1959 | 16.42 |
| Nov 15, 1993 | 16.37 |
Data provided by the National Weather Service.