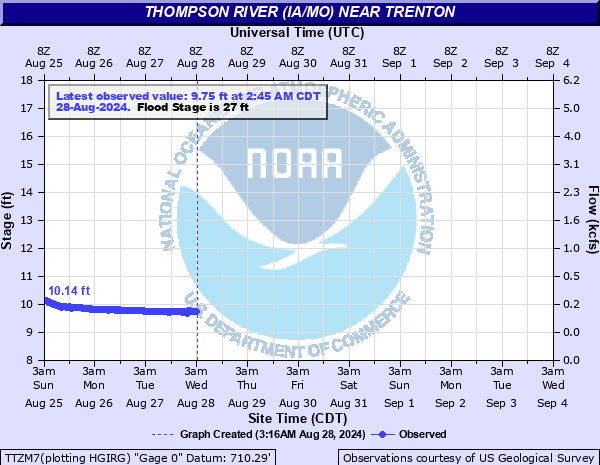
Thompson River (IA/MO) near Trenton
Critical Stages
24' - Action
27' - Flood
31' - Moderate
34' - Major
Latest Observation
Updated: 4:45 PM CST 12/15/25
Status: No Flooding
Stage: 10.32 ft
Flow: 0.16 kcfs
Forecast
Forecast not available for this location.
| Time | Stage (ft) | Flow (kcfs) |
|---|---|---|
| 4:45 PM 12/15 | 10.32 | 0.16 |
| 4:30 PM 12/15 | 10.32 | 0.16 |
| 4:15 PM 12/15 | 10.31 | 0.159 |
| 4:00 PM 12/15 | 10.31 | 0.159 |
| 3:45 PM 12/15 | 10.32 | 0.16 |
| 3:30 PM 12/15 | 10.31 | 0.159 |
| 3:15 PM 12/15 | 10.32 | 0.16 |
| 3:00 PM 12/15 | 10.32 | 0.16 |
| 2:45 PM 12/15 | 10.32 | 0.16 |
| 2:30 PM 12/15 | 10.33 | 0.162 |
| 2:15 PM 12/15 | 10.33 | 0.162 |
| 2:00 PM 12/15 | 10.33 | 0.162 |
| 1:45 PM 12/15 | 10.33 | 0.162 |
| 1:30 PM 12/15 | 10.33 | 0.162 |
| 1:15 PM 12/15 | 10.33 | 0.162 |
| 1:00 PM 12/15 | 10.33 | 0.162 |
| 12:45 PM 12/15 | 10.33 | 0.162 |
| 12:30 PM 12/15 | 10.33 | 0.162 |
| 12:15 PM 12/15 | 10.33 | 0.162 |
| 12:00 PM 12/15 | 10.33 | 0.162 |
| 11:45 AM 12/15 | 10.33 | 0.162 |
| 11:30 AM 12/15 | 10.32 | 0.16 |
| 11:15 AM 12/15 | 10.32 | 0.16 |
| 11:00 AM 12/15 | 10.33 | 0.162 |
| 10:45 AM 12/15 | 10.33 | 0.162 |
| 10:30 AM 12/15 | 10.33 | 0.162 |
| 10:15 AM 12/15 | 10.34 | 0.163 |
| 10:00 AM 12/15 | 10.33 | 0.162 |
| 9:45 AM 12/15 | 10.33 | 0.162 |
| 9:30 AM 12/15 | 10.32 | 0.16 |
45.9' -
Water overtops the Highway 6 bridge located one mile west of Trenton.
39' -
Water reaches the low-steel of the Highway 6 bridge located one mile west of Trenton.
31' -
Southwest 30th Avenue floods a quarter mile south of Highway 6. In addition, backwater flooding along Muddy Creek begins to affect Morningsun Drive in southeast Trenton.
30' -
Backwater along the Weldon River causes flooding at Northwest 22nd Avenue and Route A north of Trenton.
28' -
Low lying areas north of the gage are flooded.
| Date | Stage (ft) |
|---|---|
| May 29, 2019 | 34.38 |
| Sep 10, 2014 | 32.84 |
| Jul 25, 2008 | 32.46 |
| Jun 6, 2010 | 32.33 |
| Apr 19, 2013 | 31.52 |
| Jun 25, 2008 | 31.52 |
| Sep 13, 2008 | 31.44 |
| May 26, 2019 | 30.83 |
| May 7, 2007 | 30.81 |
| Jun 5, 2014 | 30.53 |
| Oct 9, 2018 | 29.79 |
| Aug 5, 2023 | 29.37 |
| May 2, 2024 | 28.4 |
| Jun 23, 2019 | 27.94 |
| Jun 25, 2021 | 27.4 |
Data provided by the National Weather Service.