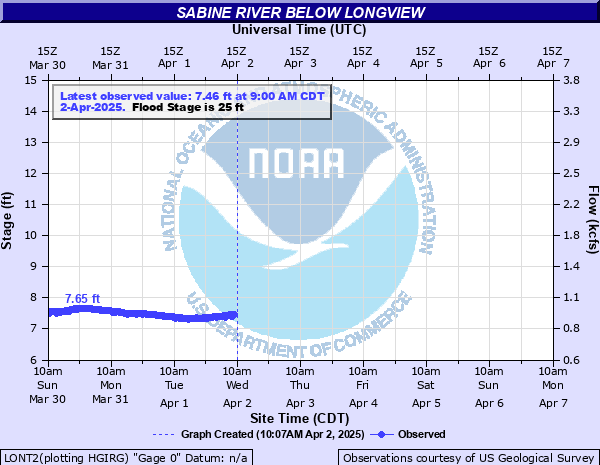
Sabine River below Longview
Critical Stages
23' - Action
25' - Flood
30' - Moderate
35' - Major
Latest Observation
Updated: 6:00 PM CST 12/6/25
Status: No Flooding
Stage: 5.65 ft
Flow: 0.54 kcfs
Forecast
Forecast not available for this location.
| Time | Stage (ft) | Flow (kcfs) |
|---|---|---|
| 6:00 PM 12/6 | 5.65 | 0.54 |
| 5:45 PM 12/6 | 5.66 | 0.543 |
| 5:30 PM 12/6 | 5.66 | 0.543 |
| 5:15 PM 12/6 | 5.66 | 0.543 |
| 5:00 PM 12/6 | 5.67 | 0.545 |
| 4:45 PM 12/6 | 5.67 | 0.545 |
| 4:30 PM 12/6 | 5.67 | 0.545 |
| 4:15 PM 12/6 | 5.67 | 0.545 |
| 4:00 PM 12/6 | 5.68 | 0.547 |
| 3:45 PM 12/6 | 5.68 | 0.547 |
| 3:30 PM 12/6 | 5.69 | 0.549 |
| 3:15 PM 12/6 | 5.69 | 0.549 |
| 3:00 PM 12/6 | 5.7 | 0.551 |
| 2:45 PM 12/6 | 5.68 | 0.547 |
| 2:30 PM 12/6 | 5.63 | 0.536 |
| 2:15 PM 12/6 | 5.7 | 0.551 |
| 2:00 PM 12/6 | 5.67 | 0.545 |
| 1:45 PM 12/6 | 5.72 | 0.555 |
| 1:30 PM 12/6 | 5.73 | 0.557 |
| 1:15 PM 12/6 | 5.73 | 0.557 |
| 1:00 PM 12/6 | 5.73 | 0.557 |
| 12:45 PM 12/6 | 5.73 | 0.557 |
| 12:30 PM 12/6 | 5.74 | 0.559 |
| 12:15 PM 12/6 | 5.74 | 0.559 |
| 12:00 PM 12/6 | 5.75 | 0.561 |
| 11:45 AM 12/6 | 5.75 | 0.561 |
| 11:30 AM 12/6 | 5.75 | 0.561 |
| 11:15 AM 12/6 | 5.76 | 0.564 |
| 11:00 AM 12/6 | 5.76 | 0.564 |
| 10:45 AM 12/6 | 5.76 | 0.564 |
41' -
Extreme flooding will continue for several more days with numerous roadways closed including interstate 20. Several tens of thousands of acres of land will be flooded. All preparations for record flooding should be rushed to completion. Expect flooding comparable to the great Sabine River flood of April of 1945.
35' -
Expect severe flooding of several thousand acres of river bottom along with petroleum equipment, secondary roadways, and several structures. Preparations should be completed for a major flooding event.
31' -
Flooding of river bottoms and lowlands will slowly decrease during the next several days.
28' -
Lowland flooding will continue for several days. Oil field operations will be curtailed and timber resources will suffer severe flooding. Fisherman should use caution as currents are swift.
25' -
Expect minor lowland flooding with boat ramps flooded.
| Date | Stage (ft) |
|---|---|
| May 2, 1966 | 40 |
| Jan 3, 2016 | 37.06 |
| May 12, 1990 | 36.7 |
| May 25, 1989 | 36 |
| Dec 17, 1971 | 35.8 |
| May 15, 2019 | 35.39 |
| Mar 16, 2016 | 34.72 |
| Mar 8, 2001 | 34.6 |
| May 1, 1973 | 34.22 |
| Dec 26, 2001 | 34.1 |
| Oct 23, 2009 | 33.75 |
| May 7, 2016 | 33.35 |
| Dec 31, 1991 | 33.3 |
| Mar 7, 2018 | 32.97 |
| May 17, 1969 | 32.9 |
| Dec 25, 1994 | 32.8 |
| Feb 11, 1975 | 32.7 |
| Mar 30, 1989 | 32.5 |
| Jun 15, 1973 | 32.5 |
| Mar 2, 1997 | 32.4 |
Data provided by the National Weather Service.