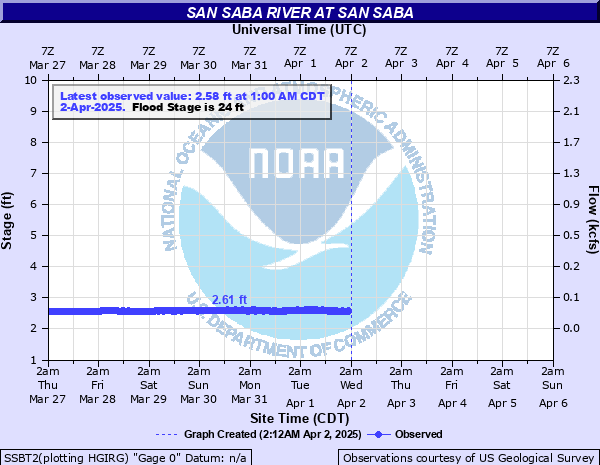
San Saba River at San Saba
Critical Stages
20' - Action
24' - Flood
27' - Moderate
31' - Major
Latest Observation
Updated: 2:00 AM CST 12/10/25
Status: No Flooding
Stage: 3.27 ft
Flow: 0.118 kcfs
Forecast
Forecast not available for this location.
| Time | Stage (ft) | Flow (kcfs) |
|---|---|---|
| 2:00 AM 12/10 | 3.27 | 0.118 |
| 1:45 AM 12/10 | 3.26 | 0.116 |
| 1:30 AM 12/10 | 3.26 | 0.116 |
| 1:15 AM 12/10 | 3.26 | 0.116 |
| 1:00 AM 12/10 | 3.26 | 0.116 |
| 12:45 AM 12/10 | 3.26 | 0.116 |
| 12:30 AM 12/10 | 3.27 | 0.118 |
| 12:15 AM 12/10 | 3.25 | 0.114 |
| 12:00 AM 12/10 | 3.27 | 0.118 |
| 11:45 PM 12/9 | 3.25 | 0.114 |
| 11:30 PM 12/9 | 3.26 | 0.116 |
| 11:15 PM 12/9 | 3.27 | 0.118 |
| 11:00 PM 12/9 | 3.25 | 0.114 |
| 10:45 PM 12/9 | 3.27 | 0.118 |
| 10:30 PM 12/9 | 3.26 | 0.116 |
| 10:15 PM 12/9 | 3.27 | 0.118 |
| 10:00 PM 12/9 | 3.25 | 0.114 |
| 9:45 PM 12/9 | 3.27 | 0.118 |
| 9:30 PM 12/9 | 3.25 | 0.114 |
| 9:15 PM 12/9 | 3.26 | 0.116 |
| 9:00 PM 12/9 | 3.26 | 0.116 |
| 8:45 PM 12/9 | 3.26 | 0.116 |
| 8:30 PM 12/9 | 3.26 | 0.116 |
| 8:15 PM 12/9 | 3.26 | 0.116 |
| 8:00 PM 12/9 | 3.26 | 0.116 |
| 7:45 PM 12/9 | 3.26 | 0.116 |
| 7:30 PM 12/9 | 3.26 | 0.116 |
| 7:15 PM 12/9 | 3.27 | 0.118 |
| 7:00 PM 12/9 | 3.26 | 0.116 |
| 6:45 PM 12/9 | 3.27 | 0.118 |
31' -
Major flooding will occur. Roads and low water crossings will be flooded.
27' -
Moderate lowland flooding will occur. Secondary roads and low water crossings will be flooded.
24' -
Minor lowland flooding will occur.
| Date | Stage (ft) |
|---|---|
| Apr 26, 1922 | 42.1 |
| Jul 23, 1938 | 39.3 |
| Jun 6, 1899 | 36.7 |
| Jul 5, 2025 | 34.28 |
| Sep 13, 1952 | 31 |
| Jul 13, 2025 | 30.84 |
| Nov 4, 2000 | 29.72 |
| Sep 18, 1990 | 29.49 |
| Sep 9, 1980 | 29.31 |
| Sep 18, 1974 | 29.28 |
| Dec 31, 1984 | 29.11 |
| Oct 14, 1973 | 29.04 |
| Dec 20, 1991 | 28.88 |
| Oct 5, 1969 | 28.85 |
| Oct 14, 1957 | 28.76 |
| Jul 17, 1990 | 28.76 |
| May 19, 1955 | 28.73 |
| May 2, 1956 | 28.55 |
| Oct 16, 2018 | 28.54 |
| Aug 29, 1974 | 28.43 |
Data provided by the National Weather Service.