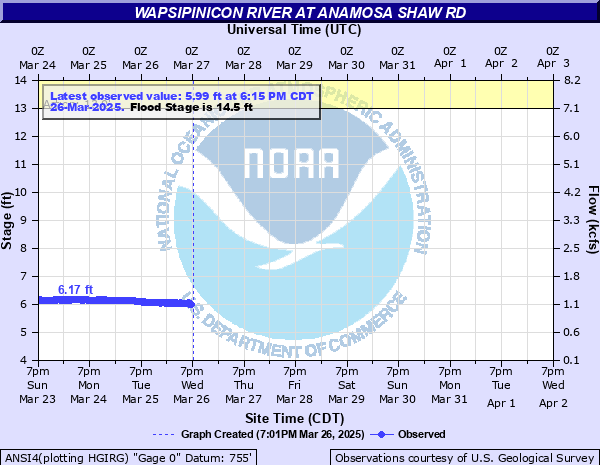
Wapsipinicon River at Anamosa Shaw Rd
Critical Stages
13' - Action
14.5' - Flood
18' - Moderate
21.5' - Major
Latest Observation
Updated: 4:15 PM CST 12/15/25
Status: No Flooding
Stage: 4.95 ft
Flow: 0.43 kcfs
Forecast
Forecast not available for this location.
| Time | Stage (ft) | Flow (kcfs) |
|---|---|---|
| 5:15 PM 12/15 | 4.94 | 0.425 |
| 5:00 PM 12/15 | 4.93 | 0.42 |
| 4:45 PM 12/15 | 4.94 | 0.425 |
| 4:30 PM 12/15 | 4.95 | 0.43 |
| 4:15 PM 12/15 | 4.95 | 0.43 |
| 4:00 PM 12/15 | 4.95 | 0.43 |
| 3:45 PM 12/15 | 4.96 | 0.435 |
| 3:30 PM 12/15 | 4.97 | 0.44 |
| 3:15 PM 12/15 | 4.99 | 0.451 |
| 3:00 PM 12/15 | 4.99 | 0.451 |
| 2:45 PM 12/15 | 5.01 | 0.461 |
| 2:30 PM 12/15 | 5.02 | 0.466 |
| 2:15 PM 12/15 | 5.04 | 0.476 |
| 2:00 PM 12/15 | 5.06 | 0.486 |
| 1:45 PM 12/15 | 5.07 | 0.491 |
| 1:30 PM 12/15 | 5.08 | 0.496 |
| 1:15 PM 12/15 | 5.11 | 0.512 |
| 1:00 PM 12/15 | 5.13 | 0.522 |
| 12:45 PM 12/15 | 5.14 | 0.527 |
| 12:30 PM 12/15 | 5.16 | 0.537 |
| 12:15 PM 12/15 | 5.18 | 0.547 |
| 12:00 PM 12/15 | 5.19 | 0.552 |
| 11:45 AM 12/15 | 5.19 | 0.552 |
| 11:30 AM 12/15 | 5.17 | 0.542 |
| 11:15 AM 12/15 | -9999 | -999 |
| 11:00 AM 12/15 | -9999 | -999 |
| 10:45 AM 12/15 | -9999 | -999 |
| 10:30 AM 12/15 | -9999 | -999 |
| 11:15 PM 12/13 | 5.24 | 0.577 |
| 11:00 PM 12/13 | 5.24 | 0.577 |
26' -
County Roads X64 and X75 are closed.
22.5' -
Water reaches Shaw Road pavement.
21.6' -
County Road X64 between Oxford Junction and Oxford Mills is closed.
21.5' -
Major Flood Stage. Stone City Road is closed.
18.8' -
Landis Road is closed.
18.3' -
Buffalo Road is closed west of Anamosa.
18' -
Moderate Flood Stage. Multiple village and township roads are closed.
17.1' -
Buffalo and Walnut Creeks begin backing up impacting local roads. 42nd Street west and east of Olin are closed.
16.5' -
Jungle Town Road is closed.
14.7' -
Water affects the Camelot Campground.
14.5' -
Flood Stage. Lead Mine Road is completely covered.
14.2' -
Lead Mine Road is closed.
14' -
Water affects the campground on Highway 38 north of Olin.
| Date | Stage (ft) |
|---|---|
| Jun 13, 2008 | 26.18 |
| Jul 26, 2010 | 23.71 |
| Jul 21, 1968 | 22.9 |
| Sep 7, 2018 | 22.82 |
| Sep 27, 2016 | 22.76 |
| May 26, 2004 | 22.73 |
| May 31, 2013 | 21.56 |
| Oct 4, 2018 | 19.51 |
| Jul 26, 2017 | 18.96 |
| Jun 30, 2014 | 18.66 |
| Aug 27, 2009 | 17.99 |
| May 29, 2024 | 17.81 |
| Jun 12, 2020 | 17.37 |
| Aug 28, 2007 | 16.22 |
| Mar 27, 2011 | 13.5 |
| May 17, 2003 | 13.08 |
| Apr 24, 2006 | 11.22 |
| Jun 25, 2015 | 11.09 |
| Feb 18, 2005 | 10.11 |
| May 11, 2012 | 8.82 |
Data provided by the National Weather Service.