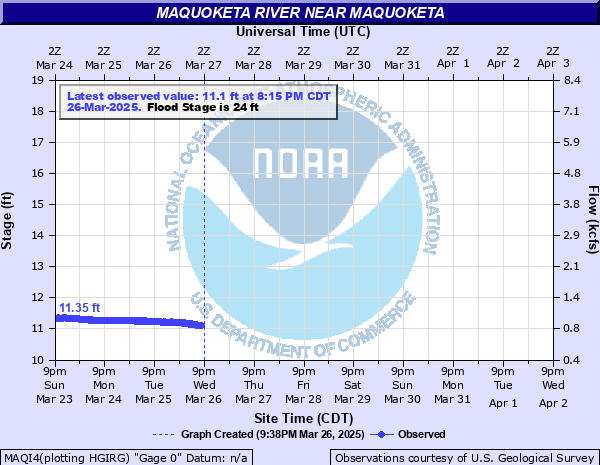
Maquoketa River near Maquoketa
Critical Stages
23' - Action
24' - Flood
26' - Moderate
28.5' - Major
Latest Observation
Updated: 4:15 PM CST 12/15/25
Status: No Flooding
Stage: 11.99 ft
Flow: 1.45 kcfs
Forecast
Forecast not available for this location.
| Time | Stage (ft) | Flow (kcfs) |
|---|---|---|
| 5:15 PM 12/15 | 12 | 1.46 |
| 5:00 PM 12/15 | 12 | 1.46 |
| 4:45 PM 12/15 | 11.99 | 1.45 |
| 4:30 PM 12/15 | 12 | 1.46 |
| 4:15 PM 12/15 | 11.99 | 1.45 |
| 4:00 PM 12/15 | 12 | 1.46 |
| 3:45 PM 12/15 | 11.99 | 1.45 |
| 3:30 PM 12/15 | 12 | 1.46 |
| 3:15 PM 12/15 | 11.99 | 1.45 |
| 3:00 PM 12/15 | 12 | 1.46 |
| 2:45 PM 12/15 | 11.99 | 1.45 |
| 2:30 PM 12/15 | 11.99 | 1.45 |
| 2:15 PM 12/15 | 11.99 | 1.45 |
| 2:00 PM 12/15 | 11.97 | 1.44 |
| 1:45 PM 12/15 | 11.94 | 1.42 |
| 1:30 PM 12/15 | 11.95 | 1.42 |
| 1:15 PM 12/15 | 11.93 | 1.41 |
| 1:00 PM 12/15 | 11.91 | 1.4 |
| 12:45 PM 12/15 | 11.89 | 1.39 |
| 12:30 PM 12/15 | 11.84 | 1.36 |
| 12:15 PM 12/15 | 11.85 | 1.36 |
| 12:00 PM 12/15 | 11.81 | 1.34 |
| 11:45 AM 12/15 | 11.8 | 1.33 |
| 11:30 AM 12/15 | 11.71 | 1.28 |
| 11:15 AM 12/15 | 11.76 | 1.31 |
| 11:00 AM 12/15 | 11.69 | 1.26 |
| 10:45 AM 12/15 | 11.72 | 1.28 |
| 10:30 AM 12/15 | 11.73 | 1.29 |
| 10:15 AM 12/15 | 11.7 | 1.27 |
| 10:00 AM 12/15 | 11.7 | 1.27 |
39' -
Water reaches the bottom of the Iowa Highway 62 bridge deck at Maquoketa.
37' -
Water is at the floor level of the Maquoketa Municipal Light Plant.
35' -
Water reaches the top of the levee which protects the industrial section at the north end of Maquoketa. Water reaches the bottom of the bridge deck at Main Street in Maquoketa.
30' -
Water affects the Maquoketa Municipal Light Plant facilities and affects Highway 113.
28.5' -
Major Flood Stage. Water is affecting the north side of the city of Maquoketa and widespread agricultural flooding.
27' -
Water affects industries on the north end of Maquoketa.
26' -
Moderate Flood Stage. Significant agricultural flooding and increasing impacts on the city of Maquoketa.
24' -
Minor Flood Stage. Water affects agricultural land in the Maquoketa area and causes backups of storm sewers in town.
| Date | Stage (ft) |
|---|---|
| Jul 26, 2010 | 35.26 |
| Jun 5, 2002 | 34.09 |
| Jul 6, 1993 | 32.86 |
| Mar 15, 2019 | 32.41 |
| Jun 14, 2008 | 31.23 |
| Jul 1, 2014 | 30.96 |
| Mar 22, 1975 | 30.63 |
| Feb 21, 1997 | 29.73 |
| Mar 11, 2013 | 29.65 |
| Aug 31, 1981 | 29.6 |
| Mar 20, 1979 | 29.18 |
| Feb 22, 1985 | 29 |
| Feb 20, 1994 | 28.65 |
| Feb 20, 2018 | 28.29 |
| Dec 31, 1972 | 28.01 |
| Jun 23, 1974 | 27.51 |
| Apr 27, 2008 | 27.51 |
| May 17, 1974 | 27.21 |
| Mar 9, 2009 | 26.88 |
| Aug 23, 2002 | 26.73 |
Data provided by the National Weather Service.