« Back to Center Junction Rivers
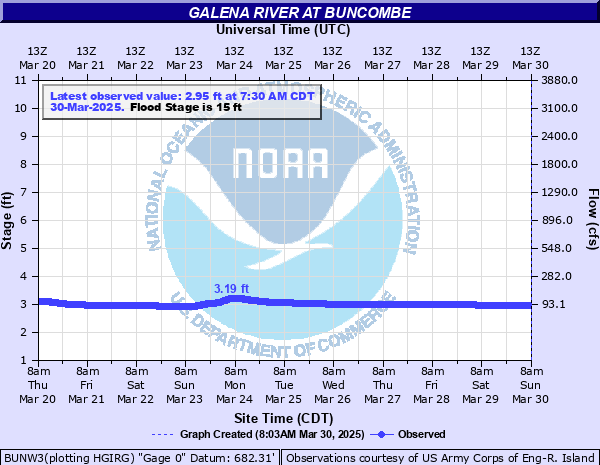
Galena River at Buncombe
Critical Stages
14.5' - Action
15' - Flood
17' - Moderate
19' - Major
Latest Observation
Updated: 1:30 AM CST 12/16/25
Status: No Flooding
Stage: 3.05 ft
Flow: 0.0906 kcfs
Forecast
Forecast not available for this location.
| Time | Stage (ft) | Flow (kcfs) |
|---|---|---|
| 1:30 AM 12/16 | 3.05 | 0.0906 |
| 1:15 AM 12/16 | 3.05 | 0.0906 |
| 1:00 AM 12/16 | 3.05 | 0.0906 |
| 12:45 AM 12/16 | 3.05 | 0.0906 |
| 12:30 AM 12/16 | 3.05 | 0.0906 |
| 12:15 AM 12/16 | 3.05 | 0.0906 |
| 12:00 AM 12/16 | 3.05 | 0.0906 |
| 11:45 PM 12/15 | 3.05 | 0.0906 |
| 11:30 PM 12/15 | 3.05 | 0.0906 |
| 11:15 PM 12/15 | 3.05 | 0.0906 |
| 11:00 PM 12/15 | 3.05 | 0.0906 |
| 10:45 PM 12/15 | 3.05 | 0.0906 |
| 10:30 PM 12/15 | 3.05 | 0.0906 |
| 10:15 PM 12/15 | 3.05 | 0.0906 |
| 10:00 PM 12/15 | 3.05 | 0.0906 |
| 9:45 PM 12/15 | 3.05 | 0.0906 |
| 9:30 PM 12/15 | 3.05 | 0.0906 |
| 9:15 PM 12/15 | 3.05 | 0.0906 |
| 9:00 PM 12/15 | 3.05 | 0.0906 |
| 8:45 PM 12/15 | 3.05 | 0.0906 |
| 8:30 PM 12/15 | 3.05 | 0.0906 |
| 8:15 PM 12/15 | 3.04 | 0.0892 |
| 8:00 PM 12/15 | 3.04 | 0.0892 |
| 7:45 PM 12/15 | 3.04 | 0.0892 |
| 7:30 PM 12/15 | 3.04 | 0.0892 |
| 7:15 PM 12/15 | 3.04 | 0.0892 |
| 7:00 PM 12/15 | 3.04 | 0.0892 |
| 6:45 PM 12/15 | 3.04 | 0.0892 |
| 6:30 PM 12/15 | 3.04 | 0.0892 |
| 6:15 PM 12/15 | 3.04 | 0.0892 |
14.5' -
There is widespread lowland and agricultural land flooding. This level is about the 10 percent chance flood meaning there is a 10 percent chance of the river reaching this level in any given year.
13.6' -
Flooding at this stage is confined mainly to lowland and agricultural land. This level is about the 20 percent chance flood meaning there is a 20 percent chance of the river reaching this level in any given year.
11.5' -
There is minor lowland flooding. This level is about the 50 percent chance flood meaning there is a 50 percent chance of the river reaching this level in any given year.
| Date | Stage (ft) |
|---|---|
| Jun 29, 1969 | 19.57 |
| Feb 26, 1937 | 17.1 |
| Jul 22, 2017 | 16.48 |
| Feb 20, 1953 | 15.68 |
| Jun 1, 2000 | 15.57 |
| Jun 29, 1990 | 14.93 |
| Sep 13, 2019 | 14.38 |
| Feb 27, 1948 | 14.3 |
| Jan 12, 1960 | 14.2 |
| May 23, 2004 | 13.09 |
| Oct 2, 2018 | 12.58 |
| Jun 8, 2008 | 11.2 |
| Feb 20, 2018 | 10.83 |
| Jun 15, 2016 | 9.33 |
| Mar 11, 2013 | 8.82 |
| Mar 11, 2015 | 6.93 |
| Mar 15, 2014 | 6.63 |
| Mar 10, 2021 | 4.66 |
| Mar 8, 2012 | 3.57 |
Data provided by the National Weather Service.