« Back to Center Lovell Rivers
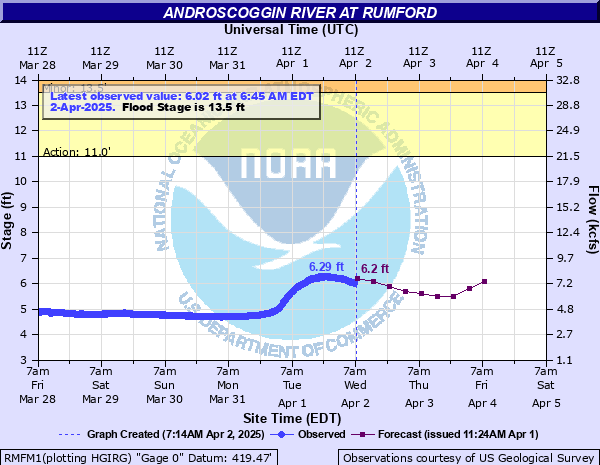
Androscoggin River at Rumford
Critical Stages
11' - Action
13.5' - Flood
17' - Moderate
19' - Major
Latest Observation
Updated: 3:15 PM EST 12/5/25
Status: No Flooding
Stage: 3.41 ft
Flow: 1.68 kcfs
Forecast
| Time | Stage (ft) | Flow (kcfs) |
|---|---|---|
| 7 PM 12/5 | 3.7 | 2.14 |
| 1 AM 12/6 | 3.7 | 2.14 |
| 7 AM 12/6 | 3.7 | 2.14 |
| 1 PM 12/6 | 3.7 | 2.14 |
| 7 PM 12/6 | 3.7 | 2.14 |
| 1 AM 12/7 | 3.7 | 2.14 |
| 7 AM 12/7 | 3.7 | 2.14 |
| 1 PM 12/7 | 3.7 | 2.14 |
| 7 PM 12/7 | 3.7 | 2.14 |
| 1 AM 12/8 | 3.7 | 2.14 |
| 7 AM 12/8 | 3.7 | 2.14 |
| Time | Stage (ft) | Flow (kcfs) |
|---|---|---|
| 3:30 PM 12/5 | 3.5 | 1.83 |
| 3:15 PM 12/5 | 3.41 | 1.68 |
| 3:00 PM 12/5 | 3.41 | 1.68 |
| 2:45 PM 12/5 | 3.33 | 1.56 |
| 2:30 PM 12/5 | 3.18 | 1.34 |
| 2:15 PM 12/5 | 3.28 | 1.48 |
| 2:00 PM 12/5 | 3.39 | 1.65 |
| 1:45 PM 12/5 | 3.39 | 1.65 |
| 1:30 PM 12/5 | 3.39 | 1.65 |
| 1:15 PM 12/5 | 3.39 | 1.65 |
| 1:00 PM 12/5 | 3.39 | 1.65 |
| 12:45 PM 12/5 | 3.39 | 1.65 |
| 12:30 PM 12/5 | 3.39 | 1.65 |
| 12:15 PM 12/5 | 3.39 | 1.65 |
| 12:00 PM 12/5 | 3.39 | 1.65 |
| 11:45 AM 12/5 | 3.39 | 1.65 |
| 11:30 AM 12/5 | 3.39 | 1.65 |
| 11:15 AM 12/5 | 3.38 | 1.63 |
| 11:00 AM 12/5 | 3.39 | 1.65 |
| 10:45 AM 12/5 | 3.39 | 1.65 |
| 10:30 AM 12/5 | 3.39 | 1.65 |
| 10:15 AM 12/5 | 3.38 | 1.63 |
| 10:00 AM 12/5 | 3.38 | 1.63 |
| 9:45 AM 12/5 | 3.39 | 1.65 |
| 9:30 AM 12/5 | 3.4 | 1.66 |
| 9:15 AM 12/5 | 3.4 | 1.66 |
| 9:00 AM 12/5 | 3.4 | 1.66 |
| 8:45 AM 12/5 | 3.41 | 1.68 |
| 8:30 AM 12/5 | 3.4 | 1.66 |
| 8:15 AM 12/5 | 3.41 | 1.68 |
25' -
Unprecedented and historic level approximately equivalent to a 500 year flood. Devastating flooding occurs from Bethel to Rumford and Peru.
24' -
Approaching levels seen during the March 1936 flood of record. Devastating flooding occurs from Bethel to Rumford Brownfield, Canton, Mexico, Dixfield, Peru, Andover, Jay, and Livermore Falls.
22' -
Approaching levels seen during the December 2023 and April 1987 floods. A significant number of dwellings between Mexico and Canton have water depths of 2 or more feet inside the first floor. The flood severity can be elevated due to coinciding high flows along the Swift River.
21' -
The area of Mexico at the confluence of the Swift and Androscoggin Rivers will experience severe flooding as well as downstream in the Ridlonville section. Flooding in Rumford is generally limited to the area along the banks of the Androscoggin River above the upper dam and on the Swift River near the mouth.
19' -
Major flooding occurs. Main thruways including Route 140 and Route 2 flooded. In Mexico, flooding occurs on Riverside Avenue, Dix Avenue, Holman Avenue, Osgood Avenue, Carlton Avenue, and Flood Street. In Rumford, flooding occurs on Prospect Avenue, Eaton Hill Road, Front Street, and Sunnyside Terrace. Hundreds of acres of farm fields also flood downstream through Jay.
17' -
Moderate Flood Stage. Flooding occurs on Carlton and Dix Streets in Mexico from a combination of the Swift River and backwater from the Androscoggin River.
16' -
Water flows across Route 2 at Falmouth Street and into Hosmer Field Athletic Complex, however the flood severity will be dependent on coinciding high flows along the Swift River.
15.5' -
Water rises to the intersection of Lincoln Avenue (Route 2) and Falmouth Street.
15' -
Route 26 in Bethel flooded between Cross Street and Intervale Road. Low spots flood along the Swift and Androscoggin Rivers in Mexico and Rumford.
14.5' -
Flooding in Bethel occurs along Intervale Road. Low spots flood along the Swift and Androscoggin Rivers in Mexico and Rumford. Route 140 between Jay and Dixfield is flooded in multiple locations.
13.7' -
The ballfield south of Lincoln Avenue or Route 2 in Rumford completely floods.
13.5' -
One lane of Route 140 inundated in Jay. Flooding occurs at the ballfield south of Lincoln Avenue in Rumford.
13' -
Water encroaches on Route 140 between Dixfield and Jay. The river is off the banks in Bethel where agricultural lands, campgrounds, and Davis Skate Park inundated.
| Date | Stage (ft) |
|---|---|
| Mar 20, 1936 | 24 |
| Apr 1, 1987 | 23.22 |
| Dec 19, 2023 | 22.12 |
| Apr 15, 1895 | 21.2 |
| Apr 15, 1805 | 19.18 |
| Mar 27, 1953 | 18.88 |
| Apr 6, 1984 | 17.25 |
| May 12, 1989 | 17.17 |
| Apr 16, 2014 | 16.69 |
| Apr 28, 1979 | 16.18 |
| Oct 31, 2017 | 16.18 |
| Apr 21, 2019 | 16 |
| Sep 17, 1999 | 16 |
| Aug 29, 2011 | 15.79 |
| May 2, 2023 | 15.76 |
| Apr 13, 2024 | 15.12 |
| Jun 15, 1998 | 15.11 |
Data provided by the National Weather Service.