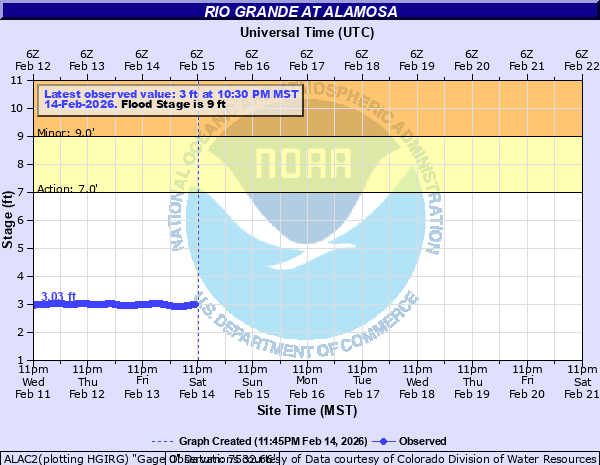
Rio Grande at Alamosa
Critical Stages
7' - Action
9' - Flood
11' - Moderate
13' - Major
Latest Observation
Updated: 3:30 PM MST 12/15/25
Status: No Flooding
Stage: 3.4 ft
Flow: 0.285 kcfs
Forecast
Forecast not available for this location.
| Time | Stage (ft) | Flow (kcfs) |
|---|---|---|
| 3:30 PM 12/15 | 3.4 | 0.285 |
| 3:15 PM 12/15 | 3.41 | 0.287 |
| 3:00 PM 12/15 | 3.42 | 0.289 |
| 2:45 PM 12/15 | 3.43 | 0.291 |
| 2:30 PM 12/15 | 3.44 | 0.293 |
| 2:15 PM 12/15 | 3.44 | 0.293 |
| 2:00 PM 12/15 | 3.45 | 0.294 |
| 1:45 PM 12/15 | 3.44 | 0.293 |
| 1:30 PM 12/15 | 3.44 | 0.293 |
| 1:15 PM 12/15 | 3.44 | 0.293 |
| 1:00 PM 12/15 | 3.44 | 0.293 |
| 12:45 PM 12/15 | 3.44 | 0.293 |
| 12:30 PM 12/15 | 3.44 | 0.293 |
| 12:15 PM 12/15 | 3.43 | 0.291 |
| 12:00 PM 12/15 | 3.43 | 0.291 |
| 11:45 AM 12/15 | 3.43 | 0.291 |
| 11:30 AM 12/15 | 3.42 | 0.289 |
| 11:15 AM 12/15 | 3.42 | 0.289 |
| 11:00 AM 12/15 | 3.42 | 0.289 |
| 10:45 AM 12/15 | 3.41 | 0.287 |
| 10:30 AM 12/15 | 3.41 | 0.287 |
| 10:15 AM 12/15 | 3.4 | 0.285 |
| 10:00 AM 12/15 | 3.4 | 0.285 |
| 9:45 AM 12/15 | 3.4 | 0.285 |
| 9:30 AM 12/15 | 3.4 | 0.285 |
| 9:15 AM 12/15 | 3.4 | 0.285 |
| 9:00 AM 12/15 | 3.39 | 0.283 |
| 8:45 AM 12/15 | 3.39 | 0.283 |
| 8:30 AM 12/15 | 3.39 | 0.283 |
| 8:15 AM 12/15 | 3.39 | 0.283 |
15' -
Major flooding. Flood waters move across Stadium Drive and into homes near Adams State College
14.5' -
Major flooding. Flood waters move into homes along Lakewood and Riverwood Drives in northeast Alamosa
14' -
Major flooding. Flood waters inundate apartments along River Drive in northeast Alamosa
13.5' -
Major flooding. Water reaches base of Highway 160 Bridge and spills into homes and park near the bridge
13' -
Major flooding. Water reaches base of State Avenue Bridge.
11.5' -
Moderate flooding. Water overtops low spots in levee protecting Alamosa and begins to flow into Cattails Golf Course and nearby homes
11' -
Moderate flooding. Moderate agricultural flooding. Water begins to overtop low spots in levee protecting Alamosa.
9' -
Minor flooding. Minor agricultural flooding in low lying areas along the river
7' -
Action Stage. The river is bankfull along portions of the reach from 8 miles upstream to 1 mile downstream.
| Date | Stage (ft) |
|---|---|
| Jun 20, 1949 | 10.62 |
| May 23, 1948 | 9.97 |
| Jun 5, 1948 | 9.87 |
| May 18, 1944 | 9.32 |
| Jul 3, 1995 | 8.84 |
| Jun 15, 2019 | 8.75 |
| Sep 24, 1997 | 7.63 |
| Oct 14, 1997 | 7.5 |
| May 25, 2005 | 7.19 |
| Jun 5, 2008 | 6.45 |
| Sep 29, 2013 | 5.54 |
| Mar 28, 2012 | 5.17 |
| May 9, 2009 | 5.13 |
| Jun 18, 1921 | -0.99 |
Data provided by the National Weather Service.