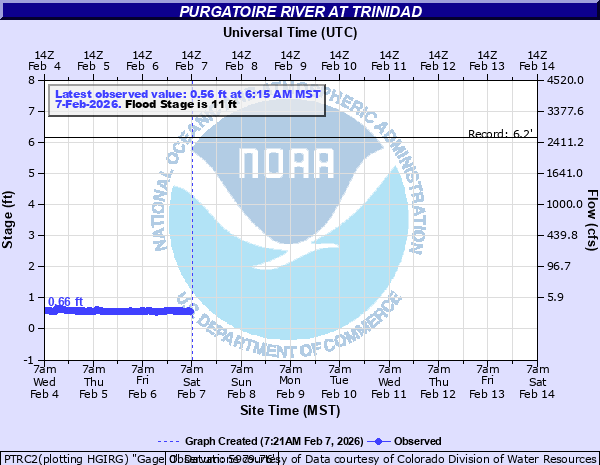
Purgatoire River at Trinidad
Critical Stages
10.5' - Action
11' - Flood
12' - Moderate
13' - Major
Latest Observation
Updated: 3:15 PM MST 12/15/25
Status: No Flooding
Stage: 1.18 ft
Flow: 0.0128 kcfs
Forecast
Forecast not available for this location.
| Time | Stage (ft) | Flow (kcfs) |
|---|---|---|
| 3:15 PM 12/15 | 1.18 | 0.0128 |
| 3:00 PM 12/15 | 1.18 | 0.0128 |
| 2:45 PM 12/15 | 1.18 | 0.0128 |
| 2:30 PM 12/15 | 1.18 | 0.0128 |
| 2:25 PM 12/15 | 1.18 | 0.0128 |
| 2:20 PM 12/15 | 1.18 | 0.0128 |
| 2:15 PM 12/15 | 1.18 | 0.0128 |
| 2:00 PM 12/15 | 1.18 | 0.0128 |
| 1:45 PM 12/15 | 1.18 | 0.0128 |
| 1:30 PM 12/15 | 1.18 | 0.0128 |
| 1:15 PM 12/15 | 1.18 | 0.0128 |
| 1:00 PM 12/15 | 1.18 | 0.0128 |
| 12:45 PM 12/15 | 1.18 | 0.0128 |
| 12:30 PM 12/15 | 1.18 | 0.0128 |
| 12:15 PM 12/15 | 1.19 | 0.0133 |
| 12:00 PM 12/15 | 1.18 | 0.0128 |
| 11:45 AM 12/15 | 1.18 | 0.0128 |
| 11:30 AM 12/15 | 1.19 | 0.0133 |
| 11:15 AM 12/15 | 1.19 | 0.0133 |
| 11:00 AM 12/15 | 1.19 | 0.0133 |
| 10:45 AM 12/15 | 1.19 | 0.0133 |
| 10:30 AM 12/15 | 1.19 | 0.0133 |
| 10:15 AM 12/15 | 1.2 | 0.0138 |
| 10:00 AM 12/15 | 1.2 | 0.0138 |
| 9:45 AM 12/15 | 1.2 | 0.0138 |
| 9:30 AM 12/15 | 1.2 | 0.0138 |
| 9:15 AM 12/15 | 1.2 | 0.0138 |
| 9:00 AM 12/15 | 1.2 | 0.0138 |
| 8:45 AM 12/15 | 1.2 | 0.0138 |
| 8:30 AM 12/15 | 1.2 | 0.0138 |
18' -
Flood waters reach the base of the railroad bridge downstream of Commercial Street.
15' -
Flood waters inundate the parking lot of the Colorado Welcome Center on Nevada Street.
13' -
Major flooding occurs in downtown Trinidad. Homes and businesses are flooded.
12.5' -
Water threatens apartments and businesses near the Commercial Street Bridge.
12' -
Water threatens businesses on Nevada Avenue.
11.5' -
Water flows into the parking lots of the McDonalds and Taco Bell restaurants.
11' -
Water reaches the railroad tracks near the Amtrak station.
10.5' -
Water reaches the base of the Commercial Street Bridge.
10' -
The river is bankfull. Minor overbank flow into low spots along the river occurs.
9.5' -
Water reaches the bike path in the park across from International Bank.
5' -
Water flows over the bike path under the Commercial Street Bridge.
| Date | Stage (ft) |
|---|---|
| May 22, 2021 | 6.63 |
| Aug 2, 1999 | 5.03 |
| Aug 12, 2004 | 4.68 |
| Jul 5, 2015 | 4.6 |
| Jul 26, 2005 | 4.48 |
| Sep 17, 2014 | 4.15 |
| Jul 16, 2013 | 3.91 |
| Sep 3, 2008 | 3.88 |
| Oct 11, 2009 | 3.87 |
Data provided by the National Weather Service.