« Back to Charlton County Rivers
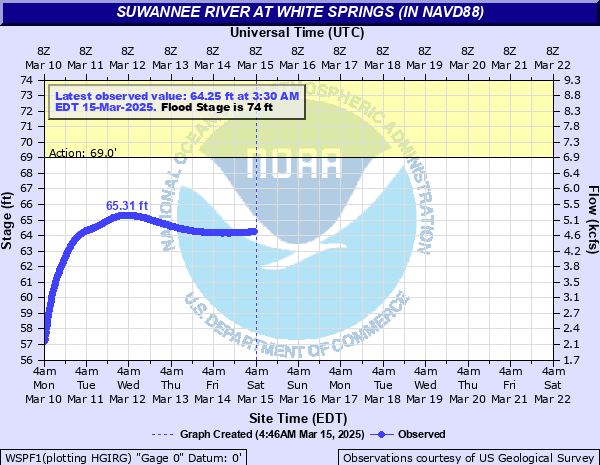
Suwannee River at White Springs (in NAVD88)
Critical Stages
69' - Action
74' - Flood
80' - Moderate
86' - Major
Latest Observation
Updated: 11:30 PM EST 12/4/25
Status: No Flooding
Stage: 49.29 ft
Flow: 0.0579 kcfs
Forecast
Forecast not available for this location.
| Time | Stage (ft) | Flow (kcfs) |
|---|---|---|
| 11:30 PM 12/4 | 49.29 | 0.0579 |
| 11:15 PM 12/4 | 49.29 | 0.0579 |
| 11:00 PM 12/4 | 49.29 | 0.0579 |
| 10:45 PM 12/4 | 49.29 | 0.0579 |
| 10:30 PM 12/4 | 49.3 | 0.059 |
| 10:15 PM 12/4 | 49.3 | 0.059 |
| 10:00 PM 12/4 | 49.3 | 0.059 |
| 9:45 PM 12/4 | 49.3 | 0.059 |
| 9:30 PM 12/4 | 49.3 | 0.059 |
| 9:15 PM 12/4 | 49.3 | 0.059 |
| 9:00 PM 12/4 | 49.3 | 0.059 |
| 8:45 PM 12/4 | 49.3 | 0.059 |
| 8:30 PM 12/4 | 49.31 | 0.0599 |
| 8:15 PM 12/4 | 49.31 | 0.0599 |
| 8:00 PM 12/4 | 49.31 | 0.0599 |
| 7:45 PM 12/4 | 49.31 | 0.0599 |
| 7:30 PM 12/4 | 49.31 | 0.0599 |
| 7:15 PM 12/4 | 49.31 | 0.0599 |
| 7:00 PM 12/4 | 49.31 | 0.0599 |
| 6:45 PM 12/4 | 49.31 | 0.0599 |
| 6:30 PM 12/4 | 49.31 | 0.0599 |
| 6:15 PM 12/4 | 49.31 | 0.0599 |
| 6:00 PM 12/4 | 49.31 | 0.0599 |
| 5:45 PM 12/4 | 49.31 | 0.0599 |
| 5:30 PM 12/4 | 49.31 | 0.0599 |
| 5:15 PM 12/4 | 49.31 | 0.0599 |
| 5:00 PM 12/4 | 49.32 | 0.0609 |
| 4:45 PM 12/4 | 49.31 | 0.0599 |
| 4:30 PM 12/4 | 49.31 | 0.0599 |
| 4:15 PM 12/4 | 49.31 | 0.0599 |
97.9' -
Water reaches the top of the Interstate 75 bridge railing.
96.5' -
Water reaches the top of the US 41 bridge railing.
96.3' -
Water reaches the top of the SR 136 bridge railing.
94.9' -
Water begins to flood the main Interstate 75 bridge travel lanes.
94.5' -
Water begins to flood the SR 136 bridge travel lanes.
93.5' -
Water begins to flood the US 41 bridge travel lanes.
92.6' -
Water begins to flood the Interstate 75 bridge travel lanes just south of the Suwannee River in Suwannee County.
90.7' -
Water reaches the approach road surface to the US 41 bridge.
89.7' -
Water reaches the approach road surface to the Interstate 75 bridge over the Suwannee River.
89.2' -
Water reaches the base of the Interstate 75 bridges over the Suwannee River. Water also reaches the base of the SR 136 bridge near White Springs.
88.5' -
Water reaches the base of the US 41 bridge.
88' -
The railroad tracks flood near the US 41 crossing.
87' -
Water reaches the base of the old US 129 foot bridge across the river. Homes in this area are subject to flooding.
86.8' -
Water reaches the approach road surface to the SR 136 bridge just north of the agriculture inspection station.
85.5' -
Water begins to flood SR 136 well south of the bridge in Columbia County.
85' -
Water reaches the base of the railroad bridge at US 41.
82' -
Water begins to surround homes along NW Stephen Foster Drive in Columbia County. Homes in the area not elevated flood at this level. In Hamilton County, the Gazebo at the Stephen F Foster State Park floods at this level.
81' -
Water reaches the observation deck at the White Springs Swim House. Water floods areas south of SE 100th Way in Hamilton County. Homes not elevated in this area are subject to flooding.
80' -
Water moves toward NW Stephen Foster Drive and begins to flood travel lanes in the 500 block in Columbia County.
79' -
Water reaches the top of the bank at the Stephen F Foster State Park. Low areas within the park begin to flood at this level.
77' -
Homes on NW Null Road in Columbia County not elevated begin to flood at this level.
75' -
Access to White Springs Swim House is impassible.
74' -
The parking lot to the Blue Sink launch floods in Suwannee County. The area is not accessible above this level. Flooding expands into the park at US 41 in Hamilton County. Much of NW Null Road in Columbia County is impassible, isolating several homes near the river.
72' -
Water reaches the top of the bank at the park at US 41 in Hamilton County. All public boat ramps between White Springs and Suwannee Springs are subject to closure. A portion of NW Null Road begins to flood in Columbia County.
70' -
Water reaches the top of the boat ramp at US 41 in Hamilton County.
| Date | Stage (ft) |
|---|---|
| Apr 10, 1973 | 87.73 |
| Jun 28, 2012 | 84.63 |
| Apr 10, 1984 | 84.57 |
| Apr 5, 1948 | 84.36 |
| Feb 26, 1998 | 83.9 |
| Sep 17, 1964 | 83.53 |
| Oct 3, 2004 | 83.2 |
| Oct 29, 1947 | 83.16 |
| Mar 22, 1959 | 82.32 |
| Nov 13, 1947 | 82.24 |
| Oct 1, 1928 | 81.61 |
| Dec 21, 2018 | 81.24 |
| Oct 5, 1929 | 81.21 |
| Aug 25, 1945 | 80.91 |
| Apr 26, 2014 | 80.82 |
| Mar 18, 1984 | 80.67 |
| Mar 19, 1948 | 80.09 |
| Apr 12, 2005 | 79.91 |
| Aug 14, 2021 | 79.85 |
| Feb 21, 1986 | 79.84 |
Data provided by the National Weather Service.