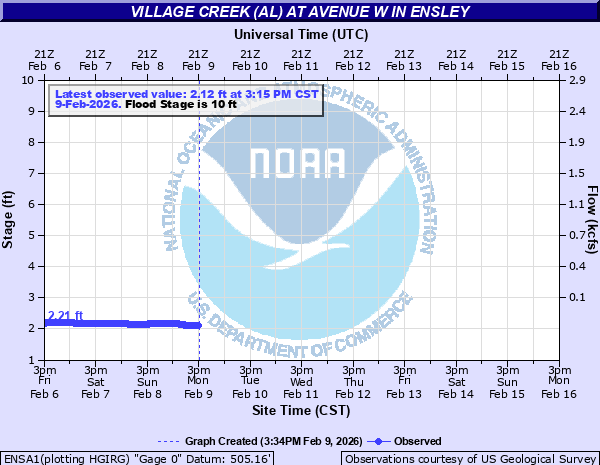
Village Creek (AL) at Avenue W in Ensley
Critical Stages
10' - Action
10' - Flood
13' - Moderate
16' - Major
Latest Observation
Updated: 9:15 AM CST 12/14/25
Status: No Flooding
Stage: 2.03 ft
Flow: -999 kcfs
Forecast
Forecast not available for this location.
| Time | Stage (ft) | Flow (kcfs) |
|---|---|---|
| 9:15 AM 12/14 | 2.03 | -999 |
| 9:00 AM 12/14 | 2.03 | -999 |
| 8:45 AM 12/14 | 2.03 | -999 |
| 8:30 AM 12/14 | 2.03 | -999 |
| 8:15 AM 12/14 | 2.03 | -999 |
| 8:00 AM 12/14 | 2.03 | -999 |
| 7:45 AM 12/14 | 2.03 | -999 |
| 7:30 AM 12/14 | 2.03 | -999 |
| 7:15 AM 12/14 | 2.03 | -999 |
| 7:00 AM 12/14 | 2.04 | -999 |
| 6:45 AM 12/14 | 2.05 | -999 |
| 6:30 AM 12/14 | 2.06 | -999 |
| 6:15 AM 12/14 | 2.06 | -999 |
| 6:00 AM 12/14 | 2.07 | -999 |
| 5:45 AM 12/14 | 2.08 | -999 |
| 5:30 AM 12/14 | 2.08 | -999 |
| 5:15 AM 12/14 | 2.08 | -999 |
| 5:00 AM 12/14 | 2.08 | -999 |
| 4:45 AM 12/14 | 2.08 | -999 |
| 4:30 AM 12/14 | 2.08 | -999 |
| 4:15 AM 12/14 | 2.08 | -999 |
| 4:00 AM 12/14 | 2.08 | -999 |
| 3:45 AM 12/14 | 2.08 | -999 |
| 3:30 AM 12/14 | 2.08 | -999 |
| 3:15 AM 12/14 | 2.08 | -999 |
| 3:00 AM 12/14 | 2.08 | -999 |
| 2:45 AM 12/14 | 2.08 | -999 |
| 2:30 AM 12/14 | 2.08 | -999 |
| 2:15 AM 12/14 | 2.08 | -999 |
| 2:00 AM 12/14 | 2.08 | -999 |
16' -
Serious residential flooding occurs in the Ensley area. Persons in low-lying areas near the creek should move to higher ground at once.
13' -
Residential flooding occurs in the Ensley area and evacuations will likely be necessary. Persons in low lying areas near the creek should move to higher ground.
12.5' -
Residential flooding begins and evacuations may become necessary. Persons in low-lying areas near the creek should move to higher ground.
11.5' -
Avenue W and other local streets in the area become impassable.
11' -
Sections of the road in the digest area of the water treatment plant are flooded. Additional flooding in the digest area of the water treatment plant occurs and increases as the creek level rises.
10' -
Flooding of low-lying areas begins in Ensley and Pratt City. The water treatment plant west of Pratt City begins to flood along the road near the digest area of the plant on the north side of the creek.
| Date | Stage (ft) |
|---|---|
| Dec 3, 1983 | 14.8 |
| Sep 5, 2011 | 14.57 |
| Feb 6, 2004 | 14.28 |
| Jun 20, 2021 | 14.22 |
| Apr 13, 1979 | 14 |
| Mar 11, 2000 | 13.96 |
| May 19, 1983 | 13.9 |
| Jan 26, 1979 | 13.79 |
| Jan 26, 1996 | 13.72 |
| Feb 26, 1996 | 13.7 |
| Mar 11, 2000 | 13.69 |
| May 8, 2003 | 13.68 |
| Sep 16, 2004 | 13.58 |
| Jan 7, 1998 | 13.54 |
| Oct 7, 2021 | 13.33 |
| Sep 7, 1977 | 13.26 |
| Apr 7, 2014 | 13.01 |
| Apr 3, 2001 | 12.93 |
| Jun 28, 1999 | 12.89 |
| Mar 7, 1996 | 12.84 |
Data provided by the National Weather Service.