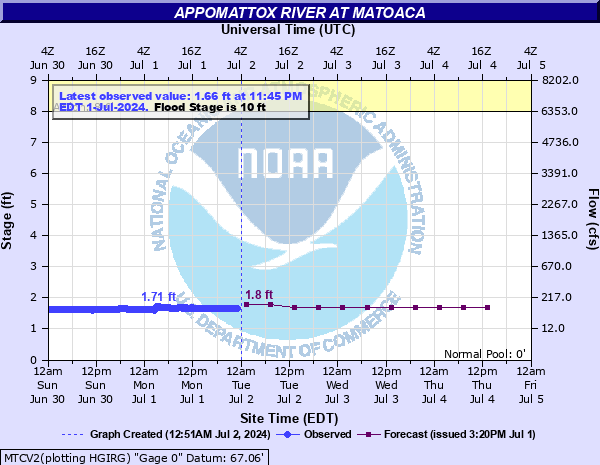
Appomattox River at Matoaca
Critical Stages
8' - Action
10' - Flood
13' - Moderate
15' - Major
Latest Observation
Updated: 1:45 AM EST 12/6/25
Status: No Flooding
Stage: 2.85 ft
Flow: 0.539 kcfs
Forecast
| Time | Stage (ft) | Flow (kcfs) |
|---|---|---|
| 7 AM 12/6 | 2.7 | 0.464 |
| 1 PM 12/6 | 2.6 | 0.417 |
| 7 PM 12/6 | 2.5 | 0.373 |
| 1 AM 12/7 | 2.5 | 0.373 |
| 7 AM 12/7 | 2.4 | 0.331 |
| 1 PM 12/7 | 2.4 | 0.331 |
| 7 PM 12/7 | 2.4 | 0.331 |
| 1 AM 12/8 | 2.4 | 0.331 |
| 7 AM 12/8 | 2.4 | 0.331 |
| Time | Stage (ft) | Flow (kcfs) |
|---|---|---|
| 2:45 AM 12/6 | 2.84 | 0.533 |
| 2:30 AM 12/6 | 2.84 | 0.533 |
| 2:15 AM 12/6 | 2.85 | 0.539 |
| 2:00 AM 12/6 | 2.86 | 0.544 |
| 1:45 AM 12/6 | 2.85 | 0.539 |
| 1:30 AM 12/6 | 2.86 | 0.544 |
| 1:15 AM 12/6 | 2.86 | 0.544 |
| 1:00 AM 12/6 | 2.86 | 0.544 |
| 12:45 AM 12/6 | 2.86 | 0.544 |
| 12:30 AM 12/6 | 2.86 | 0.544 |
| 12:15 AM 12/6 | 2.87 | 0.549 |
| 12:00 AM 12/6 | 2.86 | 0.544 |
| 11:45 PM 12/5 | 2.87 | 0.549 |
| 11:30 PM 12/5 | 2.86 | 0.544 |
| 11:15 PM 12/5 | 2.86 | 0.544 |
| 11:00 PM 12/5 | 2.86 | 0.544 |
| 10:45 PM 12/5 | 2.87 | 0.549 |
| 10:30 PM 12/5 | 2.87 | 0.549 |
| 10:15 PM 12/5 | 2.87 | 0.549 |
| 10:00 PM 12/5 | 2.87 | 0.549 |
| 9:45 PM 12/5 | 2.88 | 0.554 |
| 9:30 PM 12/5 | 2.88 | 0.554 |
| 9:15 PM 12/5 | 2.88 | 0.554 |
| 9:00 PM 12/5 | 2.88 | 0.554 |
| 8:45 PM 12/5 | 2.89 | 0.56 |
| 8:30 PM 12/5 | 2.89 | 0.56 |
| 8:15 PM 12/5 | 2.89 | 0.56 |
| 8:00 PM 12/5 | 2.9 | 0.565 |
| 7:45 PM 12/5 | 2.91 | 0.57 |
| 7:30 PM 12/5 | 2.93 | 0.581 |
36.08' -
Elevation of the Pickett Avenue Bridge floor on southern end. Northern end of bridge is under water.
33.32' -
Height of the bottom of Pickett Avenue Bridge floor support beam on southern end. Northern end of bridge is under water.
26.2' -
River stage sensor operating limit
22.78' -
Elevation of Pickett Avenue Bridge...State Route 600...bridge floor on northern end of bridge.
18.86' -
Height of the bottom of the bridge support beam on northern end of Pickett Avenue Bridge...State Route 600.
17' -
Near flood of record. Residential areas flooded.
15' -
Major flooding begins. Secondary roads begin to flood. Some residential areas are threatened.
13' -
Moderate flooding begins. Portions of Old Town Petersburg begin to flood.
10' -
Minor flooding begins. Canal begins to overflow along the right bank.
| Date | Stage (ft) |
|---|---|
| Oct 7, 1972 | 18.39 |
| May 26, 2003 | 14.61 |
| Jun 27, 1972 | 14.6 |
| Feb 26, 1979 | 14.37 |
| Oct 25, 1971 | 14.1 |
| Oct 14, 2018 | 13.86 |
| Aug 31, 2004 | 13.57 |
| Oct 3, 1979 | 13.09 |
| Sep 20, 2003 | 12.86 |
| Feb 16, 1984 | 12.63 |
| Mar 19, 1975 | 12.31 |
| Nov 6, 1985 | 12.07 |
| Apr 18, 1987 | 12.04 |
| Mar 12, 1978 | 11.98 |
| Mar 21, 1998 | 11.97 |
| Sep 24, 1979 | 11.8 |
| Sep 16, 1999 | 11.58 |
| May 2, 1978 | 11.4 |
| Dec 26, 2015 | 11.34 |
| Mar 6, 1993 | 11.32 |
Data provided by the National Weather Service.