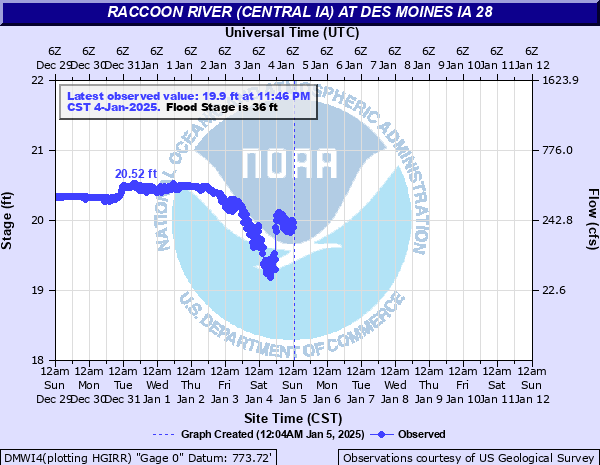
Raccoon River at Des Moines IA 28
Critical Stages
34' - Action
36' - Flood
38' - Moderate
40' - Major
Latest Observation
Updated: 9:16 AM CST 12/9/25
Status: No Flooding
Stage: 20.92 ft
Flow: 0.933 kcfs
Forecast
Forecast not available for this location.
| Time | Stage (ft) | Flow (kcfs) |
|---|---|---|
| 9:16 AM 12/9 | 20.92 | 0.933 |
| 9:01 AM 12/9 | 20.92 | 0.933 |
| 8:46 AM 12/9 | 20.92 | 0.933 |
| 8:31 AM 12/9 | 20.9 | 0.918 |
| 8:16 AM 12/9 | 20.88 | 0.902 |
| 8:01 AM 12/9 | 20.88 | 0.902 |
| 7:46 AM 12/9 | 20.86 | 0.887 |
| 7:31 AM 12/9 | 20.86 | 0.887 |
| 7:16 AM 12/9 | 20.86 | 0.887 |
| 7:01 AM 12/9 | 20.86 | 0.887 |
| 6:46 AM 12/9 | 20.84 | 0.872 |
| 6:31 AM 12/9 | 20.84 | 0.872 |
| 6:16 AM 12/9 | 20.86 | 0.887 |
| 6:01 AM 12/9 | 20.84 | 0.872 |
| 5:46 AM 12/9 | 20.84 | 0.872 |
| 5:31 AM 12/9 | 20.84 | 0.872 |
| 5:16 AM 12/9 | 20.84 | 0.872 |
| 5:01 AM 12/9 | 20.86 | 0.887 |
| 4:46 AM 12/9 | 20.86 | 0.887 |
| 4:31 AM 12/9 | 20.86 | 0.887 |
| 4:16 AM 12/9 | 20.86 | 0.887 |
| 4:01 AM 12/9 | 20.88 | 0.902 |
| 3:46 AM 12/9 | 20.88 | 0.902 |
| 3:31 AM 12/9 | 20.88 | 0.902 |
| 3:16 AM 12/9 | 20.88 | 0.902 |
| 3:01 AM 12/9 | 20.9 | 0.918 |
| 2:46 AM 12/9 | 20.9 | 0.918 |
| 2:31 AM 12/9 | 20.9 | 0.918 |
| 2:16 AM 12/9 | 20.9 | 0.918 |
| 2:01 AM 12/9 | 20.92 | 0.933 |
46.2' -
This is the top of the West Des Moines levee.
43' -
This is the top of the Des Moines levee at Iowa 28 and 63rd St.
42' -
Water is over I-35.
41.3' -
Water is at the shoulder of the southbound I-35 exit to Iowa 5.
41' -
The levee is closed at Jordan Creek and Iowa 28.
40.5' -
Water affects Grand Ave near Raccoon River Regional Park.
40' -
Iowa 28 is closed north of the river. Water affects the berm on the west side of Raccoon River Park...affecting the park and surrounding area.
39' -
Water affects businesses...Commerce Dr and Raccoon River Dr from S 88th St to Grand Ave.
38' -
Water affects primary roads in several locations.
36' -
Water affects Blue Heron Lake at Raccoon River Park.
35.5' -
Water affects Walnut Woods Dr as well as Walnut Woods State Park.
30' -
The City of West Des Moines operates the levee system including pumps.
| Date | Stage (ft) |
|---|---|
| Jun 13, 2008 | 41.31 |
| Jul 11, 1993 | 40.77 |
| Jun 26, 2015 | 40.37 |
| Jun 16, 1998 | 39.46 |
| May 24, 2004 | 38.22 |
| Apr 26, 2007 | 37.94 |
| Feb 19, 1997 | 37.52 |
| Mar 15, 2019 | 37.43 |
| Dec 15, 2015 | 37.43 |
| Jun 28, 2010 | 36.97 |
| Jun 1, 2013 | 36.25 |
| May 22, 1999 | 35.87 |
| Apr 28, 2009 | 35.78 |
| May 13, 2005 | 35.35 |
| May 9, 2003 | 35.19 |
| Sep 1, 2014 | 34.51 |
| Jun 25, 2018 | 34.04 |
| May 7, 2001 | 33.23 |
| Jun 22, 1996 | 33.12 |
| Jun 21, 2011 | 33.01 |
Data provided by the National Weather Service.