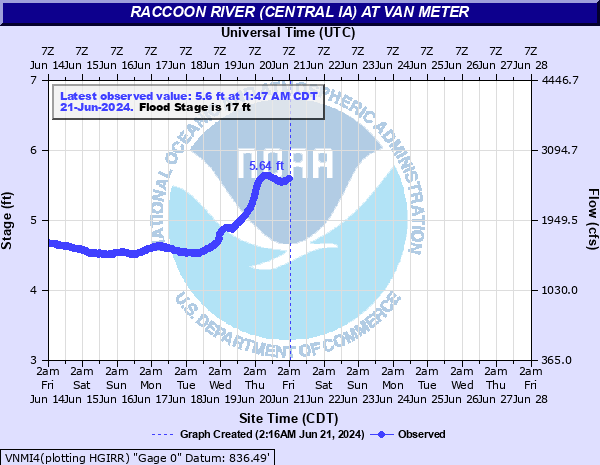
Raccoon River at Van Meter
Critical Stages
15' - Action
17' - Flood
22' - Moderate
23' - Major
Latest Observation
Updated: 9:00 AM CST 12/9/25
Status: No Flooding
Stage: 3.81 ft
Flow: 1.21 kcfs
Forecast
Forecast not available for this location.
| Time | Stage (ft) | Flow (kcfs) |
|---|---|---|
| 9:00 AM 12/9 | 3.81 | 1.21 |
| 8:45 AM 12/9 | 3.8 | 1.2 |
| 8:30 AM 12/9 | 3.8 | 1.2 |
| 8:15 AM 12/9 | 3.8 | 1.2 |
| 8:00 AM 12/9 | 3.8 | 1.2 |
| 7:45 AM 12/9 | 3.81 | 1.21 |
| 7:30 AM 12/9 | 3.84 | 1.24 |
| 7:15 AM 12/9 | 3.84 | 1.24 |
| 7:00 AM 12/9 | 3.84 | 1.24 |
| 6:45 AM 12/9 | 3.84 | 1.24 |
| 6:30 AM 12/9 | 3.84 | 1.24 |
| 6:15 AM 12/9 | 3.84 | 1.24 |
| 6:00 AM 12/9 | 3.85 | 1.25 |
| 5:45 AM 12/9 | 3.86 | 1.26 |
| 5:30 AM 12/9 | 3.86 | 1.26 |
| 5:15 AM 12/9 | 3.86 | 1.26 |
| 5:00 AM 12/9 | 3.86 | 1.26 |
| 4:45 AM 12/9 | 3.86 | 1.26 |
| 4:30 AM 12/9 | 3.85 | 1.25 |
| 4:15 AM 12/9 | 3.85 | 1.25 |
| 4:00 AM 12/9 | 3.84 | 1.24 |
| 3:45 AM 12/9 | 3.85 | 1.25 |
| 3:30 AM 12/9 | 3.85 | 1.25 |
| 3:15 AM 12/9 | 3.85 | 1.25 |
| 3:00 AM 12/9 | 3.85 | 1.25 |
| 2:45 AM 12/9 | 3.85 | 1.25 |
| 2:30 AM 12/9 | 3.85 | 1.25 |
| 2:15 AM 12/9 | 3.86 | 1.26 |
| 2:00 AM 12/9 | 3.87 | 1.26 |
| 1:45 AM 12/9 | 3.89 | 1.28 |
26' -
Water affects the railroad line north of Van Meter.
23.8' -
Water is over I-80 near Van Meter.
23.3' -
Water reaches the bottom of the I-80 bridge near Van Meter.
22.7' -
Water is at the shoulder of the southbound I-35 exit to Iowa 5.
21' -
Water affects the rangers residence at Walnut Woods State Park.
20' -
Water affects Ave R just north of the river and affects several buildings in West Des Moines in Walnut Woods State Park.
19' -
Flooding of several county roads occurs.
17' -
Water threatens secondary bridges along US 6 east of Adel.
15' -
Flooding occurs in the sand and gravel quarries just south of I-80.
13' -
Overflow occurs onto much of the east bank.
12' -
Water affects agricultural land primarily along the upstream north bank.
| Date | Stage (ft) |
|---|---|
| Jul 10, 1993 | 26.34 |
| Jun 15, 1998 | 23.29 |
| Jun 25, 2015 | 23.09 |
| Jul 1, 1986 | 22.69 |
| Jun 12, 2008 | 22.67 |
| Jul 3, 1958 | 21.77 |
| Jul 4, 1973 | 21.74 |
| May 23, 2004 | 21.59 |
| Jun 13, 1947 | 21.4 |
| Jun 16, 1990 | 21.39 |
| Apr 2, 1960 | 21.18 |
| Mar 19, 1979 | 20.39 |
| Apr 26, 2007 | 20.24 |
| May 19, 1974 | 20.13 |
| Mar 14, 2019 | 20.08 |
| Apr 30, 1984 | 19.51 |
| Jun 11, 1953 | 19.42 |
| Dec 15, 2015 | 19.34 |
| Mar 31, 1951 | 19.15 |
| Mar 19, 1948 | 19 |
Data provided by the National Weather Service.