Shoshone River near Lovell
Critical Stages
10' - Action
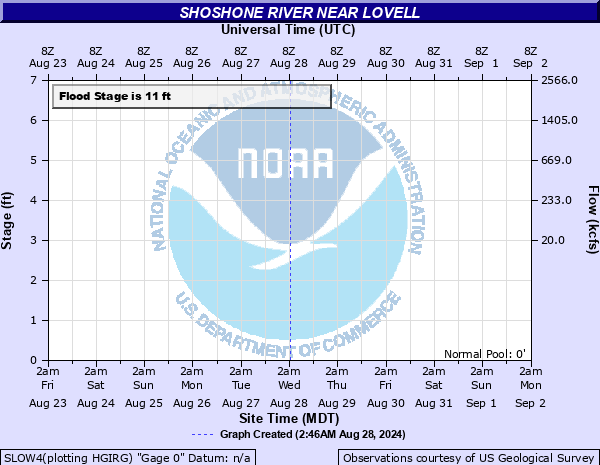
11' - Flood
11.5' - Moderate
12' - Major
Latest Observation
Updated: 7:30 AM MST 12/6/25
Status: No Flooding
Stage: 4.85 ft
Flow: 0.45 kcfs
Forecast
Forecast not available for this location.
| Time | Stage (ft) | Flow (kcfs) |
|---|---|---|
| 7:30 AM 12/6 | 4.85 | 0.45 |
| 7:15 AM 12/6 | 4.85 | 0.45 |
| 7:00 AM 12/6 | 4.85 | 0.45 |
| 6:45 AM 12/6 | 4.84 | 0.446 |
| 6:30 AM 12/6 | 4.85 | 0.45 |
| 6:15 AM 12/6 | 4.85 | 0.45 |
| 6:00 AM 12/6 | 4.85 | 0.45 |
| 5:45 AM 12/6 | 4.85 | 0.45 |
| 5:30 AM 12/6 | 4.85 | 0.45 |
| 5:15 AM 12/6 | 4.85 | 0.45 |
| 5:00 AM 12/6 | 4.85 | 0.45 |
| 4:45 AM 12/6 | 4.85 | 0.45 |
| 4:30 AM 12/6 | 4.85 | 0.45 |
| 4:15 AM 12/6 | 4.85 | 0.45 |
| 4:00 AM 12/6 | 4.85 | 0.45 |
| 3:45 AM 12/6 | 4.85 | 0.45 |
| 3:30 AM 12/6 | 4.86 | 0.455 |
| 3:15 AM 12/6 | 4.85 | 0.45 |
| 3:00 AM 12/6 | 4.85 | 0.45 |
| 2:45 AM 12/6 | 4.85 | 0.45 |
| 2:30 AM 12/6 | 4.85 | 0.45 |
| 2:15 AM 12/6 | 4.85 | 0.45 |
| 2:00 AM 12/6 | 4.85 | 0.45 |
| 1:45 AM 12/6 | 4.85 | 0.45 |
| 1:30 AM 12/6 | 4.85 | 0.45 |
| 1:15 AM 12/6 | 4.85 | 0.45 |
| 1:00 AM 12/6 | 4.85 | 0.45 |
| 12:45 AM 12/6 | 4.85 | 0.45 |
| 12:30 AM 12/6 | 4.85 | 0.45 |
| 12:15 AM 12/6 | 4.85 | 0.45 |
12' -
Water begins to enter the sewage lagoons along right bank. Major flooding of agricultural land and farm houses adjacent to river. Highway 37 may become impassable north of Cetgo Bridge.
11.5' -
Water nearing top of main dike at sewage lagoons along right bank. Dike should be monitored for erosion problems.
11.27' -
Record stage---(6/13/2001).
11' -
Flood stage. Water up against main dike at sewage lagoons along right bank. Minor flooding of agricultural land and farm houses adjacent to river. Water over low areas of Highway 37 north of Cetgo Bridge.
10' -
Bankfull stage. Standing water begins to overflow into low areas north of Highway 37 Cetgo Bridge. Minor flooding along low lying areas upstream and downstream of Lovell.
9.16' -
Record flow---16,400 cfs (6/10/1981).
| Date | Stage (ft) |
|---|---|
| Jun 18, 2018 | 11.51 |
| Jun 13, 2001 | 11.27 |
| Jun 18, 2009 | 11.08 |
| Jul 5, 1998 | 10.53 |
| Jul 15, 2011 | 10.52 |
| Jun 30, 2020 | 10.47 |
| Jul 1, 1996 | 10.4 |
| Feb 5, 1996 | 10.2 |
| Jul 9, 2008 | 10.17 |
| Jun 27, 2005 | 9.92 |
| Jun 20, 2003 | 9.88 |
| Jun 15, 1997 | 9.77 |
| Jul 2, 2017 | 9.43 |
| Jun 16, 2015 | 9.41 |
| Feb 1, 2002 | 9.36 |
| Jul 15, 1995 | 9.2 |
| Jun 10, 1981 | 9.16 |
| May 28, 2019 | 9.08 |
| Mar 7, 2014 | 8.74 |
| Jul 14, 2014 | 8.51 |
Data provided by the National Weather Service.