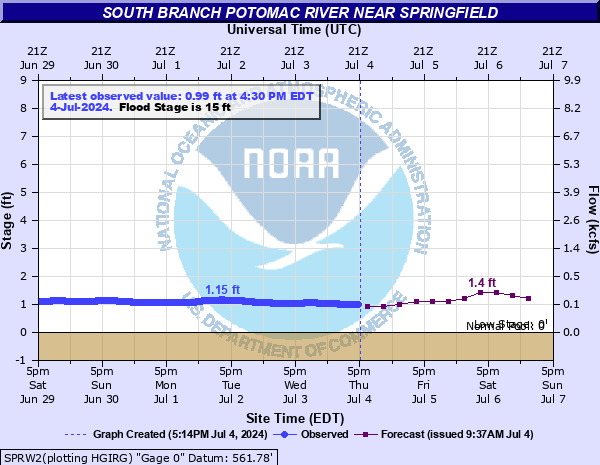
South Branch Potomac River near Springfield
Critical Stages
12' - Action
15' - Flood
19' - Moderate
25' - Major
Latest Observation
Updated: 4:30 PM EST 12/15/25
Status: No Flooding
Stage: 1.29 ft
Flow: 0.208 kcfs
Forecast
| Time | Stage (ft) | Flow (kcfs) |
|---|---|---|
| 7 PM 12/15 | 1.4 | 0.249 |
| 1 AM 12/16 | 1.4 | 0.249 |
| 7 AM 12/16 | 1.3 | 0.211 |
| 1 PM 12/16 | 1.3 | 0.211 |
| 7 PM 12/16 | 1.4 | 0.249 |
| 1 AM 12/17 | 1.4 | 0.249 |
| 7 AM 12/17 | 1.5 | 0.29 |
| 1 PM 12/17 | 1.4 | 0.249 |
| 7 PM 12/17 | 1.4 | 0.249 |
| 1 AM 12/18 | 1.5 | 0.29 |
| 7 AM 12/18 | 1.4 | 0.249 |
| Time | Stage (ft) | Flow (kcfs) |
|---|---|---|
| 4:30 PM 12/15 | 1.29 | 0.208 |
| 4:15 PM 12/15 | 1.27 | 0.201 |
| 4:00 PM 12/15 | 1.25 | 0.194 |
| 3:45 PM 12/15 | 1.24 | 0.191 |
| 3:30 PM 12/15 | 1.22 | 0.184 |
| 3:15 PM 12/15 | 1.21 | 0.181 |
| 3:00 PM 12/15 | 1.2 | 0.178 |
| 2:45 PM 12/15 | 1.2 | 0.178 |
| 2:30 PM 12/15 | 1.2 | 0.178 |
| 2:15 PM 12/15 | 1.21 | 0.181 |
| 2:00 PM 12/15 | 1.22 | 0.184 |
| 1:45 PM 12/15 | 1.24 | 0.191 |
| 1:30 PM 12/15 | 1.27 | 0.201 |
| 1:15 PM 12/15 | 1.29 | 0.208 |
| 1:00 PM 12/15 | 1.34 | 0.226 |
| 12:45 PM 12/15 | 1.38 | 0.241 |
| 12:30 PM 12/15 | 1.42 | 0.257 |
| 12:15 PM 12/15 | 1.45 | 0.269 |
| 12:00 PM 12/15 | 1.49 | 0.286 |
| 11:45 AM 12/15 | 1.53 | 0.303 |
| 11:30 AM 12/15 | 1.55 | 0.312 |
| 11:15 AM 12/15 | 1.56 | 0.317 |
| 11:00 AM 12/15 | 1.55 | 0.312 |
| 10:45 AM 12/15 | 1.55 | 0.312 |
| 10:30 AM 12/15 | 1.55 | 0.312 |
| 10:15 AM 12/15 | 1.56 | 0.317 |
| 10:00 AM 12/15 | 1.58 | 0.326 |
| 9:45 AM 12/15 | 1.62 | 0.345 |
| 9:30 AM 12/15 | 1.65 | 0.359 |
| 9:15 AM 12/15 | 1.58 | 0.326 |
25' -
Most camphouses and a large portion of fields in the area are flooded.
19' -
Houses on the right downstream side of the river are flooded.
17' -
Water approaches camphouses downstream from the gage.
15' -
Milleson Mill Road (County Route 28/5) and Clarence Taylor Road (Route 3/7) begin to flood. Water covers a significant portion of meadowlands near the river. The boat launch ramp on the upstream right abutment of the bridge also floods.
11' -
The river begins to overflow the banks in a few low lying areas. Campers should move away from the river.
5' -
Hazardous conditions for recreation may exist.
| Date | Stage (ft) |
|---|---|
| Nov 5, 1985 | 44.22 |
| Sep 7, 1996 | 34.98 |
| Mar 18, 1936 | 34.2 |
| Jun 18, 1949 | 29.85 |
| Jan 20, 1996 | 28.41 |
| Aug 19, 1955 | 25.55 |
| Sep 20, 2003 | 24.7 |
| Oct 10, 1976 | 23.42 |
| Apr 27, 1937 | 23 |
| Mar 20, 1963 | 22.15 |
| May 23, 1942 | 22 |
| Oct 16, 1954 | 21.5 |
| Feb 4, 1939 | 21.4 |
| Oct 29, 1937 | 21.15 |
| Oct 6, 1972 | 21.11 |
| Oct 16, 1942 | 21.09 |
| Mar 8, 1967 | 21 |
| Feb 4, 1932 | 20.4 |
| Mar 20, 1975 | 20.34 |
| Dec 27, 1973 | 20.16 |
Data provided by the National Weather Service.