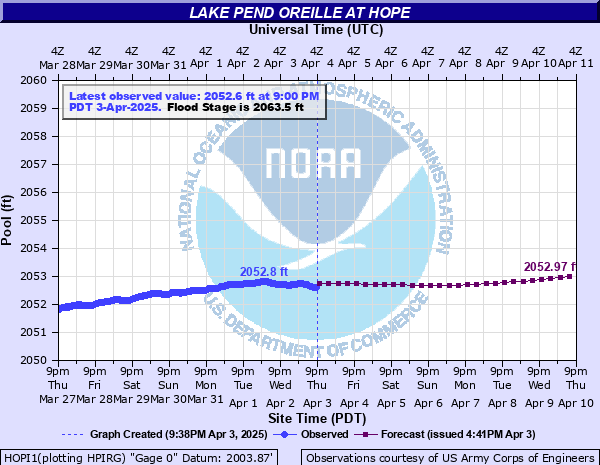
Lake Pend Oreille at Hope
Critical Stages
2062.6' - Action
2063.5' - Flood
2066' - Moderate
2069' - Major
Latest Observation
Updated: 7:00 AM PST 12/5/25
Status: No Flooding
Stage: 2051.36 ft
Flow: -999 kcfs
Forecast
| Time | Stage (ft) | Flow (kcfs) |
|---|---|---|
| 10 AM 12/5 | 2051.35 | -999 |
| 4 PM 12/5 | 2051.33 | -999 |
| 10 PM 12/5 | 2051.32 | -999 |
| 4 AM 12/6 | 2051.31 | -999 |
| 10 AM 12/6 | 2051.3 | -999 |
| 4 PM 12/6 | 2051.29 | -999 |
| 10 PM 12/6 | 2051.28 | -999 |
| 4 AM 12/7 | 2051.27 | -999 |
| 10 AM 12/7 | 2051.26 | -999 |
| 4 PM 12/7 | 2051.25 | -999 |
| 10 PM 12/7 | 2051.25 | -999 |
| 4 AM 12/8 | 2051.25 | -999 |
| 10 AM 12/8 | 2051.25 | -999 |
| 4 PM 12/8 | 2051.25 | -999 |
| 10 PM 12/8 | 2051.25 | -999 |
| 4 AM 12/9 | 2051.25 | -999 |
| 10 AM 12/9 | 2051.25 | -999 |
| 4 PM 12/9 | 2051.25 | -999 |
| 10 PM 12/9 | 2051.25 | -999 |
| 4 AM 12/10 | 2051.25 | -999 |
| 10 AM 12/10 | 2051.25 | -999 |
| 4 PM 12/10 | 2051.25 | -999 |
| 10 PM 12/10 | 2051.25 | -999 |
| 4 AM 12/11 | 2051.25 | -999 |
| 10 AM 12/11 | 2051.25 | -999 |
| 4 PM 12/11 | 2051.25 | -999 |
| 10 PM 12/11 | 2051.25 | -999 |
| 4 AM 12/12 | 2051.25 | -999 |
| 10 AM 12/12 | 2051.25 | -999 |
| 4 PM 12/12 | 2051.25 | -999 |
| 10 PM 12/12 | 2051.25 | -999 |
| 4 AM 12/13 | 2051.25 | -999 |
| 10 AM 12/13 | 2051.25 | -999 |
| 4 PM 12/13 | 2051.25 | -999 |
| 10 PM 12/13 | 2051.25 | -999 |
| 4 AM 12/14 | 2051.25 | -999 |
| Time | Stage (ft) | Flow (kcfs) |
|---|---|---|
| 7:00 AM 12/5 | 2051.36 | -999 |
| 6:00 AM 12/5 | 2051.36 | -999 |
| 5:00 AM 12/5 | 2051.38 | -999 |
| 4:00 AM 12/5 | 2051.38 | -999 |
| 3:00 AM 12/5 | 2051.39 | -999 |
| 2:00 AM 12/5 | 2051.39 | -999 |
| 1:00 AM 12/5 | 2051.41 | -999 |
| 12:00 AM 12/5 | 2051.42 | -999 |
| 11:00 PM 12/4 | 2051.41 | -999 |
| 10:00 PM 12/4 | 2051.42 | -999 |
| 9:00 PM 12/4 | 2051.43 | -999 |
| 8:00 PM 12/4 | 2051.43 | -999 |
| 7:00 PM 12/4 | 2051.42 | -999 |
| 6:00 PM 12/4 | 2051.42 | -999 |
| 5:00 PM 12/4 | 2051.42 | -999 |
| 4:00 PM 12/4 | 2051.43 | -999 |
| 3:00 PM 12/4 | 2051.42 | -999 |
| 2:00 PM 12/4 | 2051.41 | -999 |
| 1:00 PM 12/4 | 2051.41 | -999 |
| 12:00 PM 12/4 | 2051.41 | -999 |
| 11:00 AM 12/4 | 2051.41 | -999 |
| 10:00 AM 12/4 | 2051.4 | -999 |
| 9:00 AM 12/4 | 2051.4 | -999 |
| 8:00 AM 12/4 | 2051.42 | -999 |
| 7:00 AM 12/4 | 2051.42 | -999 |
| 6:00 AM 12/4 | 2051.41 | -999 |
| 5:00 AM 12/4 | 2051.42 | -999 |
| 4:00 AM 12/4 | 2051.43 | -999 |
| 3:00 AM 12/4 | 2051.43 | -999 |
| 2:00 AM 12/4 | 2051.42 | -999 |
2071' -
Extensive flooding is likely. Some flooding in the Sandpoint business district can also be expected. Lake level of 2071 feet is in reference to the NGVD29 datum.
2071' -
Extensive flooding is likely. Some flooding in the Sandpoint business district can also be expected. Lake level of 2071 feet is in reference to the NGVD29 datum.
2069' -
Major flooding of lakeside homes and docks adjacent to the lake is likely. Significant flooding can also be expected along the Pack, Priest, and Clark Fork River valleys near the lake. Lake level of 2069 feet is in reference to the NGVD29 datum.
2065.75' -
Portions of Lakeview Avenue in Bayview will be flooded. Extensive damage to docks in Bayview. In 1997 water approached the sewer lift station in Bayview, and the lake level threatened to raise boat houses above their mooring piers.
2065.5' -
Flooding of some lakeside homes and docks is likely. In 1997 several homes and docks were damaged near Bayview. Lake level of 2065.5 feet is in reference to the NGVD29 datum.
2064' -
Minor flooding of driveways and low lands in the Pack and Clark Fork River Valleys near the lake. Scenic Bay RV sites and part of parking lot at Scenic Bay Marina in Bayview will be flooded. Most dock ramps around the lake will be underwater. Part of the parking lot behind the Power House in Sandpoint will be flooded. Water will begin to cover part of the sidewalk behind the Edgewater Resort in Sandpoint. Flooding of parking lot and picnic area at Trestle Creek Rec Area. 2064 feet is referenced to NGVD29.
2063.5' -
Minor flooding of dock ramps, yards, and recreational sites around the lake can be expected. Some erosional damage from wave action is possible along the windward shores. Lake level of 2063.5 feet is in reference to the NGVD29 datum.
| Date | Stage (ft) |
|---|---|
| Jun 1, 1894 | 2075.88 |
| Jun 9, 1948 | 2071.62 |
| Jun 20, 1933 | 2068.76 |
| Jun 10, 1950 | 2067.11 |
| Jun 5, 1997 | 2065.74 |
| Jun 12, 1972 | 2065.7 |
| Jun 23, 1974 | 2065.47 |
| Jun 17, 2011 | 2064.29 |
| May 30, 2018 | 2064.2 |
| Sep 5, 2015 | 2062.49 |
| Jul 29, 2016 | 2062.48 |
| Jul 8, 2014 | 2062.48 |
| Jun 19, 2021 | 2062.46 |
| Jul 18, 2020 | 2062.45 |
| Aug 2, 2013 | 2062.45 |
| Jun 16, 2019 | 2062.44 |
| Jul 19, 2017 | 2062.44 |
| Jul 12, 2022 | 2062.4 |
| Jul 11, 2023 | 2062.39 |
| Aug 7, 2012 | 2062.38 |
Data provided by the National Weather Service.