Rabbit Creek at Kilgore
Critical Stages
10' - Action
10' - Flood
14' - Moderate
18' - Major
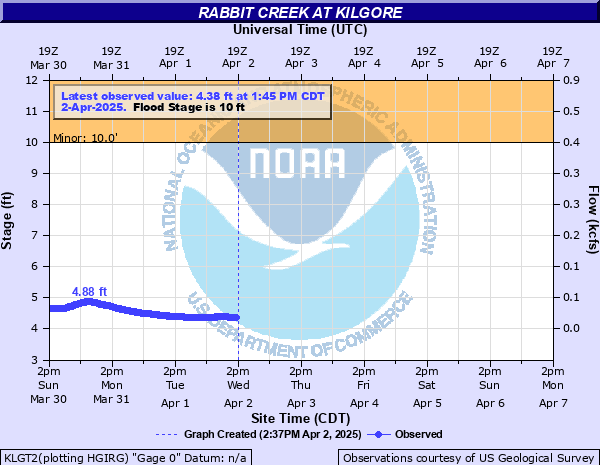
Latest Observation
Updated: 6:45 PM CST 12/7/25
Status: No Flooding
Stage: 3.96 ft
Flow: 0.0224 kcfs
Forecast
Forecast not available for this location.
| Time | Stage (ft) | Flow (kcfs) |
|---|---|---|
| 6:45 PM 12/7 | 3.96 | 0.0224 |
| 6:30 PM 12/7 | 3.96 | 0.0224 |
| 6:15 PM 12/7 | 3.96 | 0.0224 |
| 6:00 PM 12/7 | 3.96 | 0.0224 |
| 5:45 PM 12/7 | 3.96 | 0.0224 |
| 5:30 PM 12/7 | 3.96 | 0.0224 |
| 5:15 PM 12/7 | 3.96 | 0.0224 |
| 5:00 PM 12/7 | 3.96 | 0.0224 |
| 4:45 PM 12/7 | 3.96 | 0.0224 |
| 4:30 PM 12/7 | 3.96 | 0.0224 |
| 4:15 PM 12/7 | 3.96 | 0.0224 |
| 4:00 PM 12/7 | 3.96 | 0.0224 |
| 3:45 PM 12/7 | 3.96 | 0.0224 |
| 3:30 PM 12/7 | 3.96 | 0.0224 |
| 3:15 PM 12/7 | 3.96 | 0.0224 |
| 3:00 PM 12/7 | 3.96 | 0.0224 |
| 2:45 PM 12/7 | 3.97 | 0.023 |
| 2:30 PM 12/7 | 3.96 | 0.0224 |
| 2:15 PM 12/7 | 3.96 | 0.0224 |
| 2:00 PM 12/7 | 3.96 | 0.0224 |
| 1:45 PM 12/7 | 3.97 | 0.023 |
| 1:30 PM 12/7 | 3.97 | 0.023 |
| 1:15 PM 12/7 | 3.96 | 0.0224 |
| 1:00 PM 12/7 | 3.97 | 0.023 |
| 12:45 PM 12/7 | 3.97 | 0.023 |
| 12:30 PM 12/7 | 3.97 | 0.023 |
| 12:15 PM 12/7 | 3.97 | 0.023 |
| 12:00 PM 12/7 | 3.97 | 0.023 |
| 11:45 AM 12/7 | 3.96 | 0.0224 |
| 11:30 AM 12/7 | 3.97 | 0.023 |
20' -
Near record flooding expected with near record flooding of the Turkey Creek tributary with a couple of homes in danger of flooding.
18' -
Expect major flooding on the Turkey Creek tributary. The pipeline right of way completely flooded at this stage as well.
16' -
Expect flooding on small tributaries to Rabbit Creek to begin such as Turkey Creek. Also expect a couple of barns to flood as well.
14' -
Expect about one hundred acres to flood.
12' -
Expect flooded trails and a private boat launch.
10' -
Expect lowland flooding of timber resources in and near the creek. Some oil field operations may be affected.
| Date | Stage (ft) |
|---|---|
| Apr 30, 2016 | 20.81 |
| Mar 9, 2016 | 20.3 |
| Jul 11, 1945 | 19.6 |
| May 2, 2019 | 18.29 |
| Apr 24, 1966 | 16.4 |
| Apr 25, 2019 | 15.19 |
| Dec 28, 2015 | 15.17 |
| Dec 27, 2018 | 14.98 |
| Nov 12, 2018 | 14.68 |
| Dec 14, 2015 | 14.25 |
| Jan 19, 2017 | 13.83 |
| Oct 27, 1970 | 13.82 |
| Apr 17, 2021 | 13.54 |
| Feb 3, 1975 | 13.34 |
| Apr 18, 2016 | 13.21 |
| Apr 13, 1969 | 13.12 |
| Feb 22, 2018 | 13.08 |
| Apr 25, 1973 | 12.88 |
| May 10, 1968 | 12.71 |
| Mar 2, 2018 | 12.15 |
Data provided by the National Weather Service.