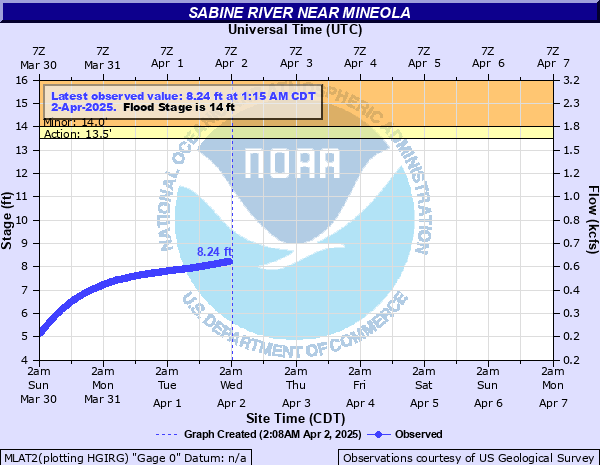
Sabine River near Mineola
Critical Stages
13.5' - Action
14' - Flood
18' - Moderate
21' - Major
Latest Observation
Updated: 6:15 PM CST 12/7/25
Status: No Flooding
Stage: 1.9 ft
Flow: 0.047 kcfs
Forecast
Forecast not available for this location.
| Time | Stage (ft) | Flow (kcfs) |
|---|---|---|
| 6:15 PM 12/7 | 1.9 | 0.047 |
| 6:00 PM 12/7 | 1.87 | 0.0458 |
| 5:45 PM 12/7 | 1.89 | 0.0466 |
| 5:30 PM 12/7 | 1.91 | 0.0474 |
| 5:15 PM 12/7 | 1.91 | 0.0474 |
| 5:00 PM 12/7 | 1.91 | 0.0474 |
| 4:45 PM 12/7 | 1.92 | 0.0478 |
| 4:30 PM 12/7 | 1.93 | 0.0482 |
| 4:15 PM 12/7 | 1.89 | 0.0466 |
| 4:00 PM 12/7 | 1.92 | 0.0478 |
| 3:45 PM 12/7 | 1.93 | 0.0482 |
| 3:30 PM 12/7 | 1.89 | 0.0466 |
| 3:15 PM 12/7 | 1.93 | 0.0482 |
| 3:00 PM 12/7 | 1.93 | 0.0482 |
| 2:45 PM 12/7 | 1.92 | 0.0478 |
| 2:30 PM 12/7 | 1.92 | 0.0478 |
| 2:15 PM 12/7 | 1.92 | 0.0478 |
| 2:00 PM 12/7 | 1.92 | 0.0478 |
| 1:45 PM 12/7 | 1.92 | 0.0478 |
| 1:30 PM 12/7 | 1.93 | 0.0482 |
| 1:15 PM 12/7 | 1.94 | 0.0486 |
| 1:00 PM 12/7 | 1.94 | 0.0486 |
| 12:45 PM 12/7 | 1.91 | 0.0474 |
| 12:30 PM 12/7 | 1.94 | 0.0486 |
| 12:15 PM 12/7 | 1.94 | 0.0486 |
| 12:00 PM 12/7 | 1.92 | 0.0478 |
| 11:45 AM 12/7 | 1.94 | 0.0486 |
| 11:30 AM 12/7 | 1.95 | 0.049 |
| 11:15 AM 12/7 | 1.95 | 0.049 |
| 11:00 AM 12/7 | 1.96 | 0.0494 |
20' -
Expect several flooded barns and farm buildings.
18' -
Expect a couple of flooded barns. Also expect water to overflow the bridge approaches to Farm to Market Highway 1804 between Hoard and Lindale. Expect several hundred acres of flooded pasturelands next to the river both upstream and downstream. Move livestock and equipment to higher ground.
16' -
Expect flooding of low river bottoms with secondary roadways along with picnic and recreational areas becoming inundated as well. Ranchers should move cattle and equipment to higher ground.
14' -
Expect flooding of secondary roadways with picnic and recreational areas flooded as well. Also expect flooded boat ramps as well.
| Date | Stage (ft) |
|---|---|
| Jun 8, 1943 | 24.37 |
| Apr 1, 1945 | 24 |
| Apr 29, 1957 | 22.15 |
| Apr 11, 1942 | 21.63 |
| Dec 11, 1971 | 21.53 |
| May 5, 1990 | 21.09 |
| Dec 29, 2015 | 20.84 |
| Nov 7, 1946 | 20.75 |
| May 4, 1944 | 20.65 |
| Apr 30, 1958 | 20.6 |
| Jun 2, 1946 | 20.6 |
| Jan 25, 1938 | 20.6 |
| May 19, 1989 | 20.24 |
| Dec 1, 2015 | 20.18 |
| May 2, 1953 | 19.91 |
| Feb 5, 1950 | 19.82 |
| Jul 8, 2007 | 19.8 |
| Apr 21, 1976 | 19.75 |
| May 9, 1969 | 19.62 |
| May 10, 2019 | 19.53 |
Data provided by the National Weather Service.