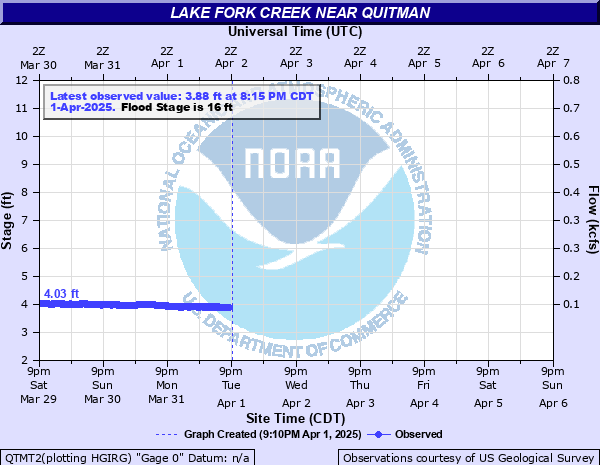
Lake Fork Creek near Quitman
Critical Stages
15.5' - Action
16' - Flood
18' - Moderate
20' - Major
Latest Observation
Updated: 6:15 PM CST 12/7/25
Status: No Flooding
Stage: 3.47 ft
Flow: 0.0123 kcfs
Forecast
Forecast not available for this location.
| Time | Stage (ft) | Flow (kcfs) |
|---|---|---|
| 6:15 PM 12/7 | 3.47 | 0.0123 |
| 6:00 PM 12/7 | 3.47 | 0.0123 |
| 5:45 PM 12/7 | 3.46 | 0.0118 |
| 5:30 PM 12/7 | 3.48 | 0.0128 |
| 5:15 PM 12/7 | 3.47 | 0.0123 |
| 5:00 PM 12/7 | 3.48 | 0.0128 |
| 4:45 PM 12/7 | 3.47 | 0.0123 |
| 4:30 PM 12/7 | 3.46 | 0.0118 |
| 4:15 PM 12/7 | 3.47 | 0.0123 |
| 4:00 PM 12/7 | 3.47 | 0.0123 |
| 3:45 PM 12/7 | 3.47 | 0.0123 |
| 3:30 PM 12/7 | 3.46 | 0.0118 |
| 3:15 PM 12/7 | 3.48 | 0.0128 |
| 3:00 PM 12/7 | 3.48 | 0.0128 |
| 2:45 PM 12/7 | 3.47 | 0.0123 |
| 2:30 PM 12/7 | 3.47 | 0.0123 |
| 2:15 PM 12/7 | 3.47 | 0.0123 |
| 2:00 PM 12/7 | 3.48 | 0.0128 |
| 1:45 PM 12/7 | 3.47 | 0.0123 |
| 1:30 PM 12/7 | 3.47 | 0.0123 |
| 1:15 PM 12/7 | 3.47 | 0.0123 |
| 1:00 PM 12/7 | 3.48 | 0.0128 |
| 12:45 PM 12/7 | 3.49 | 0.0134 |
| 12:30 PM 12/7 | 3.48 | 0.0128 |
| 12:15 PM 12/7 | 3.47 | 0.0123 |
| 12:00 PM 12/7 | 3.47 | 0.0123 |
| 11:45 AM 12/7 | 3.48 | 0.0128 |
| 11:30 AM 12/7 | 3.49 | 0.0134 |
| 11:15 AM 12/7 | 3.49 | 0.0134 |
| 11:00 AM 12/7 | 3.48 | 0.0128 |
22' -
Numerous barns as well as farm buildings will be threatened with serious flooding. All cattle and equipment should be evacuated well away from the creek. Preparations should be rushed to completion for severe flooding. The creek will remain above flood stage for several days as necessary releases to lower high water levels at lake fork continue.
20' -
Lowland flooding will continue to slowly decrease as reservoir releases from lake fork dam will continue to slowly decrease.
19' -
Preparations should be rushed to completion for major flooding problems. Some barns in the floodplain will be facing flooding.
16' -
Expect minor lowland flooding problems. Ranchers that may have cattle and equipment in the creek bottoms should move them to higher ground.
| Date | Stage (ft) |
|---|---|
| Mar 30, 1945 | 29.85 |
| Jun 7, 1943 | 25.9 |
| Jul 1, 1895 | 25.9 |
| Dec 10, 1971 | 25.1 |
| Apr 28, 1958 | 24.38 |
| Dec 28, 2015 | 23.26 |
| Apr 9, 1942 | 23 |
| Apr 26, 1966 | 23 |
| Dec 17, 2001 | 22.4 |
| Feb 3, 1950 | 21.81 |
| May 18, 1989 | 21.75 |
| May 4, 1990 | 21.75 |
| Jun 16, 2000 | 21.34 |
| May 8, 1969 | 21.29 |
| May 3, 1944 | 21.21 |
| Apr 30, 1953 | 21.05 |
| Feb 3, 1975 | 21.02 |
| May 12, 1948 | 20.66 |
| May 1, 1976 | 20.6 |
| Jul 16, 1994 | 20.49 |
Data provided by the National Weather Service.