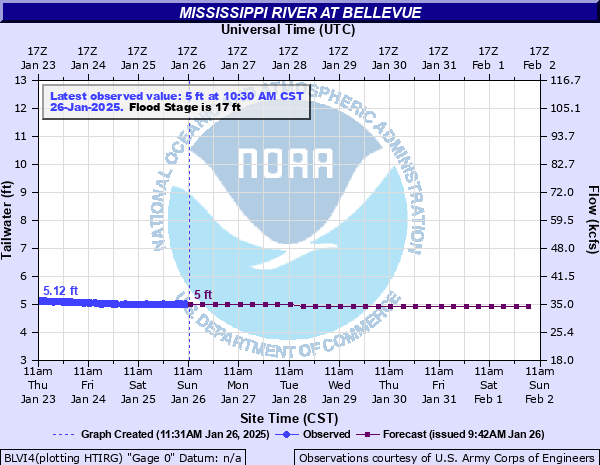
Mississippi River at Bellevue
Critical Stages
16' - Action
17' - Flood
18' - Moderate
20' - Major
Latest Observation
Updated: 1:30 AM CST 12/16/25
Status: No Flooding
Stage: 4.7 ft
Flow: 32 kcfs
Forecast
| Time | Stage (ft) | Flow (kcfs) |
|---|---|---|
| 6 AM 12/16 | 4.8 | 33 |
| 12 PM 12/16 | 4.8 | 33 |
| 6 PM 12/16 | 4.8 | 33 |
| 12 AM 12/17 | 4.8 | 33 |
| 6 AM 12/17 | 4.8 | 33 |
| 12 PM 12/17 | 4.7 | 32 |
| 6 PM 12/17 | 4.7 | 32 |
| 12 AM 12/18 | 4.7 | 32 |
| 6 AM 12/18 | 4.7 | 32 |
| 12 PM 12/18 | 4.7 | 32 |
| 6 PM 12/18 | 4.7 | 32 |
| 12 AM 12/19 | 4.7 | 32 |
| 6 AM 12/19 | 4.7 | 32 |
| 12 PM 12/19 | 4.7 | 32 |
| 6 PM 12/19 | 4.7 | 32 |
| 12 AM 12/20 | 4.7 | 32 |
| 6 AM 12/20 | 4.7 | 32 |
| 12 PM 12/20 | 4.7 | 32 |
| 6 PM 12/20 | 4.7 | 32 |
| 12 AM 12/21 | 4.7 | 32 |
| 6 AM 12/21 | 4.7 | 32 |
| 12 PM 12/21 | 4.7 | 32 |
| 6 PM 12/21 | 4.6 | 31.1 |
| 12 AM 12/22 | 4.6 | 31.1 |
| 6 AM 12/22 | 4.6 | 31.1 |
| Time | Stage (ft) | Flow (kcfs) |
|---|---|---|
| 1:30 AM 12/16 | 4.7 | 32 |
| 1:20 AM 12/16 | 4.69 | 31.9 |
| 1:10 AM 12/16 | 4.69 | 31.9 |
| 1:00 AM 12/16 | 4.7 | 32 |
| 12:50 AM 12/16 | 4.7 | 32 |
| 12:40 AM 12/16 | 4.69 | 31.9 |
| 12:30 AM 12/16 | 4.7 | 32 |
| 12:20 AM 12/16 | 4.71 | 32.1 |
| 12:10 AM 12/16 | 4.7 | 32 |
| 12:00 AM 12/16 | 4.71 | 32.1 |
| 11:50 PM 12/15 | 4.7 | 32 |
| 11:40 PM 12/15 | 4.71 | 32.1 |
| 11:30 PM 12/15 | 4.7 | 32 |
| 11:20 PM 12/15 | 4.72 | 32.2 |
| 11:10 PM 12/15 | 4.7 | 32 |
| 11:00 PM 12/15 | 4.71 | 32.1 |
| 10:50 PM 12/15 | 4.7 | 32 |
| 10:40 PM 12/15 | 4.7 | 32 |
| 10:30 PM 12/15 | 4.7 | 32 |
| 10:20 PM 12/15 | 4.72 | 32.2 |
| 10:10 PM 12/15 | 4.72 | 32.2 |
| 10:00 PM 12/15 | 4.72 | 32.2 |
| 9:50 PM 12/15 | 4.71 | 32.1 |
| 9:40 PM 12/15 | 4.71 | 32.1 |
| 9:30 PM 12/15 | 4.7 | 32 |
| 9:20 PM 12/15 | 4.71 | 32.1 |
| 9:10 PM 12/15 | 4.72 | 32.2 |
| 9:00 PM 12/15 | 4.71 | 32.1 |
| 8:50 PM 12/15 | 4.72 | 32.2 |
| 8:40 PM 12/15 | 4.72 | 32.2 |
27.5' -
Water affects the Iowa causeway. Water is also on U.S. Highway 52 through Sabula Lakes.
26.7' -
Water reaches the top of the dike at Sabula.
25' -
Water affects Mill Creek Park in Bellevue.
24.5' -
Water affects Driscolls Island at Sabula.
24.3' -
Water affects the main floor of Potters Mill in Bellevue.
24' -
Water affects U.S. Highway 52 south of Bellevue. Water also affects the railroad tracks near Spruce Creek Park on the north end of town.
23.3' -
Water affects the trailers at Shady Haven in Bellevue. Water affects the U.S. Highway 52 causeway in Sabula.
22.8' -
Water reaches the clearance under the Illinois causeway bridge at Sabula.
21.9' -
Water on railroad tracks and into some businesses in Savanna.
21.5' -
Water affects a few homes just south of Bellevue.
21' -
Water encroaches onto Driscolls Island at Sabula.
20.1' -
Basement flooding occurs in homes and businesses with seepage into yards in Savanna. Grain elevators are also affected. Water affects the lower portion of Marquette Parking lot. Water affects Vulcan and South Broad Streets in Sabula.
20' -
Water affects the railroad tracks south of Bellevue. Water is also into the Municipal Boat Ramp parking lot. Water affects the riverfront parking lot in Savanna.
19.2' -
Basement flooding occurs in homes and businesses with seepage into a few yards in Savanna. Water seeps into yards on Pearl and Broad Streets in Sabula.
19' -
Water surrounds trailers on Riverview in Bellevue. Water affects a baseball field in Sabula.
18.5' -
Water affects access to trailer park at Mill Creek in Bellevue. Water affects lowest homes in Sabula.
18.4' -
Lock and Dam 12 is closed.
18' -
Water affects the riverfront parking lot in Savanna. Water affects the boat launch at North Sabula Access in Sabula. There is also seepage into basements, yards, and gutters.
17.8' -
Water affects Spruce Creek Park on the north end of Bellevue.
17.5' -
Water affects a few homes south of Bellevue. Water affects operations at a grain elevator in Savanna. Water affects the lowest businesses in Sabula.
17.4' -
Water affects businesses on North River Drive in Sabula.
17.3' -
Water affects the railroad underpass at Mill Creek in Bellevue.
17' -
Rural damage occurs near Bellevue.
16.5' -
Water affects a convenience store on the south end of Bellevue east of Ridgeview. Water is also at the base of foundations of the lowest businesses on Riverview near Jefferson St.
14' -
Water affects the camping areas at Blanding Landing and Pleasant Creek Recreation Areas.
| Date | Stage (ft) |
|---|---|
| Apr 26, 1965 | 23.51 |
| Apr 22, 2001 | 22.58 |
| Apr 29, 2023 | 21.78 |
| Jul 1, 1993 | 21.5 |
| Apr 29, 2019 | 20.87 |
| Apr 20, 2011 | 20.58 |
| Jul 7, 2024 | 20.17 |
| Apr 17, 1997 | 20.16 |
| Apr 26, 1952 | 20.11 |
| Apr 24, 1969 | 20.06 |
| Apr 23, 1951 | 20 |
| May 6, 1975 | 19.95 |
| Oct 6, 1986 | 19.21 |
| Apr 24, 1973 | 19.13 |
| Apr 13, 1967 | 18.93 |
| Jun 14, 2008 | 18.7 |
| Jul 3, 2014 | 18.68 |
| Sep 21, 1938 | 17.9 |
| Mar 17, 1983 | 17.75 |
| May 13, 1954 | 17.57 |
Data provided by the National Weather Service.