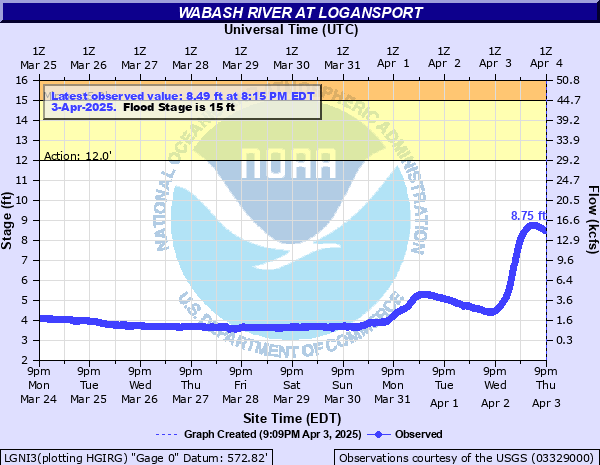
Wabash River at Logansport
Critical Stages
12' - Action
15' - Flood
19' - Moderate
21' - Major
Latest Observation
Updated: 7:03 PM LMT 12/31/00
Status: Obs Not Current
Stage: -999 ft
Flow: -999 kcfs
Forecast
Forecast not available for this location.
| Time | Stage (ft) | Flow (kcfs) |
|---|---|---|
| 3:30 AM 12/14 | 3.42 | 0.877 |
| 3:15 AM 12/14 | 3.31 | 0.729 |
| 3:00 AM 12/14 | 3.16 | 0.535 |
| 2:45 AM 12/14 | 3.06 | 0.421 |
| 2:30 AM 12/14 | 3 | 0.358 |
| 2:15 AM 12/14 | 2.98 | 0.338 |
| 2:00 AM 12/14 | 2.95 | 0.306 |
| 1:45 AM 12/14 | 2.94 | 0.295 |
| 1:30 AM 12/14 | 2.96 | 0.317 |
| 1:15 AM 12/14 | 2.98 | 0.338 |
| 1:00 AM 12/14 | 2.99 | 0.348 |
| 12:45 AM 12/14 | 3 | 0.358 |
| 12:30 AM 12/14 | 3 | 0.358 |
| 12:15 AM 12/14 | 3.01 | 0.368 |
| 12:00 AM 12/14 | 3.01 | 0.368 |
| 11:45 PM 12/13 | 3.01 | 0.368 |
| 11:30 PM 12/13 | 3.02 | 0.378 |
| 11:15 PM 12/13 | 3.02 | 0.378 |
| 11:00 PM 12/13 | 3.03 | 0.388 |
| 10:45 PM 12/13 | 3.04 | 0.399 |
| 10:30 PM 12/13 | 3.05 | 0.41 |
| 10:15 PM 12/13 | 3.05 | 0.41 |
| 10:00 PM 12/13 | 3.05 | 0.41 |
| 9:45 PM 12/13 | 3.04 | 0.399 |
| 9:30 PM 12/13 | 3.04 | 0.399 |
| 9:15 PM 12/13 | 3.04 | 0.399 |
| 9:00 PM 12/13 | 3.06 | 0.421 |
| 8:45 PM 12/13 | 3.06 | 0.421 |
| 8:30 PM 12/13 | 3.07 | 0.433 |
| 8:15 PM 12/13 | 3.08 | 0.443 |
25' -
Flooding up to 4th Street in downtown area. Widespread flooding in outlying area with devastation in central Logansport. Many roads and bridges along Wabash River under water.
21' -
A very serious flood in progress with evacuation necessary.
19' -
Flooding of downtown businesses below 4th Street and one to two blocks either side of Goose Creek.
17' -
Flooding of residences along Wabash Av., Eel River Av., E. Melbourne Av., Biddle Island, Cliff St., Brown St., Georgetown Rd., S. River Rd West, east end of Pottawatomic Rd., near Cass Station Bridge and Goose Creek area begins to flood.
15' -
Flooding of Wastewater Treatment Plant and many river cabins and residences along Wabash River begins.
14.5' -
The Wabash River has not exceed this level since the start of the 3 flood control reseervoirs located upstream since 1967.
12' -
Flooding of low-lying agricultural and recreational areas begins.
| Date | Stage (ft) |
|---|---|
| Mar 26, 1913 | 25.3 |
| May 18, 1943 | 21.32 |
| Feb 1, 1883 | 20.3 |
| Feb 11, 1959 | 19.69 |
| Jan 5, 1950 | 18.82 |
| Feb 27, 1936 | 17.85 |
| Jun 12, 1958 | 17.8 |
| Jan 15, 1930 | 17.8 |
| Mar 27, 1904 | 17.1 |
| Feb 16, 1950 | 16.45 |
| Apr 29, 1959 | 16.44 |
| Mar 13, 1939 | 16.4 |
| Apr 12, 1944 | 15.87 |
| May 12, 1943 | 15.43 |
| Mar 21, 1933 | 15.1 |
| Jan 16, 1937 | 15.08 |
| Apr 9, 1938 | 15.03 |
| Mar 21, 1927 | 15 |
| Apr 20, 2013 | 14.9 |
| Apr 23, 1964 | 14.64 |
Data provided by the National Weather Service.