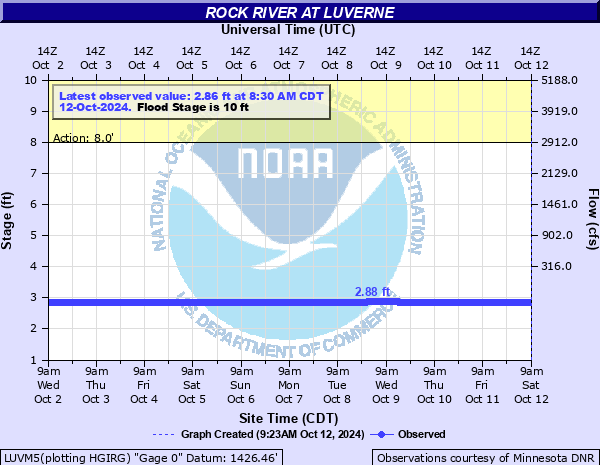
Rock River at Luverne
Critical Stages
8' - Action
10' - Flood
12' - Moderate
14' - Major
Latest Observation
Updated: 8:30 PM CST 12/14/25
Status: No Flooding
Stage: 3.07 ft
Flow: 0.0949 kcfs
Forecast
Forecast not available for this location.
| Time | Stage (ft) | Flow (kcfs) |
|---|---|---|
| 9:30 PM 12/14 | 3.06 | 0.0887 |
| 9:15 PM 12/14 | 3.06 | 0.0887 |
| 9:00 PM 12/14 | 3.07 | 0.0949 |
| 8:45 PM 12/14 | 3.07 | 0.0949 |
| 8:30 PM 12/14 | 3.07 | 0.0949 |
| 8:15 PM 12/14 | 3.07 | 0.0949 |
| 8:00 PM 12/14 | 3.07 | 0.0949 |
| 7:45 PM 12/14 | 3.07 | 0.0949 |
| 7:30 PM 12/14 | 3.07 | 0.0949 |
| 7:15 PM 12/14 | 3.07 | 0.0949 |
| 7:00 PM 12/14 | 3.07 | 0.0949 |
| 6:45 PM 12/14 | 3.07 | 0.0949 |
| 6:30 PM 12/14 | 3.07 | 0.0949 |
| 6:15 PM 12/14 | 3.07 | 0.0949 |
| 6:00 PM 12/14 | 3.07 | 0.0949 |
| 5:45 PM 12/14 | 3.07 | 0.0949 |
| 5:30 PM 12/14 | 3.06 | 0.0887 |
| 5:15 PM 12/14 | 3.06 | 0.0887 |
| 5:00 PM 12/14 | 3.06 | 0.0887 |
| 4:45 PM 12/14 | 3.07 | 0.0949 |
| 4:30 PM 12/14 | 3.07 | 0.0949 |
| 4:15 PM 12/14 | 3.06 | 0.0887 |
| 4:00 PM 12/14 | 3.07 | 0.0949 |
| 3:45 PM 12/14 | 3.07 | 0.0949 |
| 3:30 PM 12/14 | 3.07 | 0.0949 |
| 3:15 PM 12/14 | 3.06 | 0.0887 |
| 3:00 PM 12/14 | 3.06 | 0.0887 |
| 2:45 PM 12/14 | 3.07 | 0.0949 |
| 2:30 PM 12/14 | 3.06 | 0.0887 |
| 2:15 PM 12/14 | 3.06 | 0.0887 |
20' -
The bridge on Highway 4 at the gage is overtopped.
18.5' -
The lowest portions of E Main St in Luverne are flooded as are numerous structures.
16' -
Water reaches the bottom of the bridge on Highway 4 at the gage.
15' -
The railroad tracks in Luverne are flooded and additional structures are threatened.
13.5' -
The right bank levee in Luverne is overtopped and floods the baseball field. This may also allow water to approach some structurs on the eastern edge of Luverne.
12' -
The left bank levees at the Luverne city park begin to be overtopped and the park may be under 5 to 6 feet of water.
10' -
Significant agricultural flooding begins.
8' -
The lowest lying areas begin to flood.
| Date | Stage (ft) |
|---|---|
| Jun 17, 2014 | 14.86 |
| May 8, 1993 | 14.23 |
| Sep 13, 2019 | 13.94 |
| Jun 22, 2024 | 13.61 |
| Jun 13, 1914 | 13.2 |
| Apr 8, 1969 | 13.13 |
| Sep 24, 2010 | 12.69 |
| Apr 23, 2001 | 12.25 |
| Mar 14, 2007 | 11.85 |
| Jun 22, 2018 | 11.7 |
| Mar 28, 1997 | 11.69 |
| Sep 22, 1986 | 11.11 |
| Jun 25, 1984 | 10.53 |
| Mar 21, 2019 | 10.47 |
| Mar 21, 1978 | 9.78 |
| Jul 15, 2011 | 9.62 |
| Mar 11, 1985 | 9.55 |
| Apr 7, 2006 | 9.47 |
| Jun 13, 1994 | 9.35 |
| Mar 15, 1972 | 9.23 |
Data provided by the National Weather Service.