Redwood River at Russell
Critical Stages
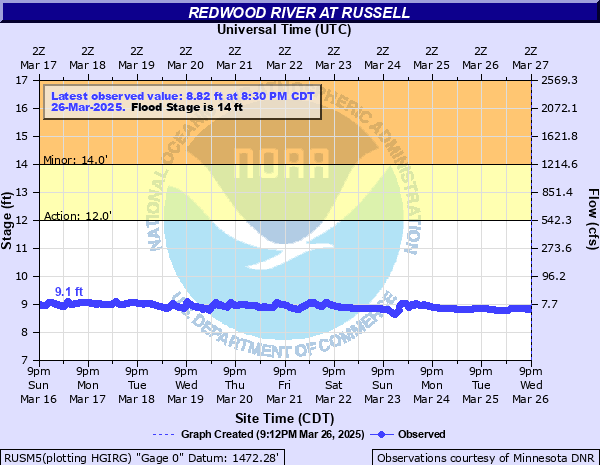
12' - Action
14' - Flood
17' - Moderate
20' - Major
Latest Observation
Updated: 9:30 PM CST 12/14/25
Status: No Flooding
Stage: 8.01 ft
Flow: -999 kcfs
Forecast
Forecast not available for this location.
| Time | Stage (ft) | Flow (kcfs) |
|---|---|---|
| 9:30 PM 12/14 | 8.01 | -999 |
| 9:15 PM 12/14 | 8.02 | -999 |
| 9:00 PM 12/14 | 8.01 | -999 |
| 8:45 PM 12/14 | 8.03 | -999 |
| 8:30 PM 12/14 | 8.78 | 0.0028 |
| 8:15 PM 12/14 | 8.67 | 0.0016 |
| 8:00 PM 12/14 | 8.62 | 0.0011 |
| 7:45 PM 12/14 | 8.59 | 0.0003 |
| 7:30 PM 12/14 | 8.57 | 0 |
| 7:15 PM 12/14 | 8.04 | -999 |
| 7:00 PM 12/14 | 7.99 | -999 |
| 6:45 PM 12/14 | 7.99 | -999 |
| 6:30 PM 12/14 | 8.01 | -999 |
| 6:15 PM 12/14 | 8.01 | -999 |
| 6:00 PM 12/14 | 8.01 | -999 |
| 5:45 PM 12/14 | 8.02 | -999 |
| 5:30 PM 12/14 | 8.04 | -999 |
| 5:15 PM 12/14 | 8.11 | -999 |
| 5:00 PM 12/14 | 8.37 | 0 |
| 4:45 PM 12/14 | 8.88 | 0.0052 |
| 4:30 PM 12/14 | 8.3 | 0 |
| 4:15 PM 12/14 | 8.27 | 0 |
| 4:00 PM 12/14 | 8.96 | 0.0071 |
| 3:45 PM 12/14 | 8.96 | 0.0071 |
| 3:30 PM 12/14 | 8.96 | 0.0071 |
| 3:15 PM 12/14 | 8.91 | 0.0062 |
| 3:00 PM 12/14 | 8.18 | -999 |
| 2:45 PM 12/14 | 8.37 | 0 |
| 2:30 PM 12/14 | 8.51 | 0 |
| 2:15 PM 12/14 | 8.9 | 0.006 |
31.5' -
The bridge at the gaging location is overtopped.
28' -
Water reaches the bottom of the bridge at the gaging location.
23' -
The bridge on N Redwood St in Lynd is overtopped.
21' -
The bridge on County Road 60 southwest of Russell is overtopped as is the bridge on N River Rd in Lynd.
20' -
A couple low lying houses along the river in Lynd may flood.
19' -
Water reaches the bottom of the bridge on County Road 60 southwest of Russell and the bottom of the bridge of N River Rd in Lynd.
17.5' -
The park begins to flood in Russell and may approach some low lying houses along the river in Russell.
14' -
Low lying areas begin to flood
| Date | Stage (ft) |
|---|---|
| Sep 25, 2010 | 20.01 |
| Mar 28, 2019 | 18.5 |
| Jul 4, 2018 | 18.2 |
| Apr 24, 2001 | 18.11 |
| Mar 23, 2011 | 17.85 |
| Jun 23, 2024 | 16.73 |
| Mar 14, 2007 | 15.8 |
| May 7, 2012 | 15.44 |
| Apr 13, 2023 | 14.63 |
| Mar 9, 2020 | 14.47 |
| Jun 18, 2014 | 14.2 |
| May 13, 2022 | 14.12 |
| May 24, 2017 | 12.96 |
| Jun 12, 2008 | 12.1 |
| Apr 9, 2021 | 11.57 |
Data provided by the National Weather Service.