« Back to Columbus Municipal Automatic Weather Observing Rivers
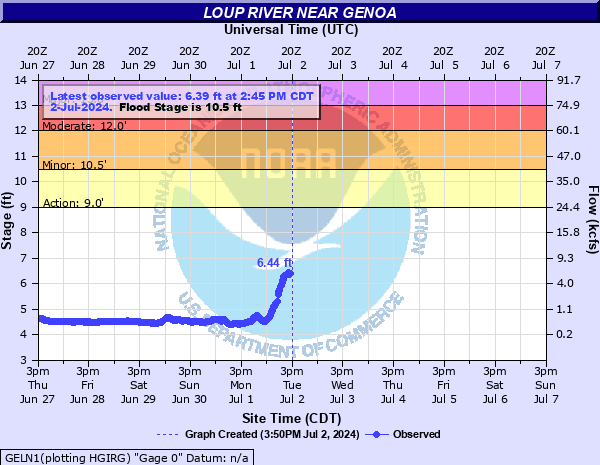
Loup River near Genoa
Critical Stages
9' - Action
10.5' - Flood
12' - Moderate
13' - Major
Latest Observation
Updated: 11:45 PM CST 12/17/25
Status: No Flooding
Stage: 5.33 ft
Flow: 3.38 kcfs
Forecast
Forecast not available for this location.
| Time | Stage (ft) | Flow (kcfs) |
|---|---|---|
| 11:45 PM 12/17 | 5.33 | 3.38 |
| 11:30 PM 12/17 | 5.33 | 3.38 |
| 11:15 PM 12/17 | 5.32 | 3.34 |
| 11:00 PM 12/17 | 5.33 | 3.38 |
| 10:45 PM 12/17 | 5.34 | 3.43 |
| 10:30 PM 12/17 | 5.35 | 3.48 |
| 10:15 PM 12/17 | 5.33 | 3.38 |
| 10:00 PM 12/17 | 5.33 | 3.38 |
| 9:45 PM 12/17 | 5.34 | 3.43 |
| 9:30 PM 12/17 | 5.34 | 3.43 |
| 9:15 PM 12/17 | 5.34 | 3.43 |
| 9:00 PM 12/17 | 5.34 | 3.43 |
| 8:45 PM 12/17 | 5.32 | 3.34 |
| 8:30 PM 12/17 | 5.31 | 3.29 |
| 8:15 PM 12/17 | 5.34 | 3.43 |
| 8:00 PM 12/17 | 5.32 | 3.34 |
| 7:45 PM 12/17 | 5.34 | 3.43 |
| 7:30 PM 12/17 | 5.35 | 3.48 |
| 7:15 PM 12/17 | 5.34 | 3.43 |
| 7:00 PM 12/17 | 5.35 | 3.48 |
| 6:45 PM 12/17 | 5.34 | 3.43 |
| 6:30 PM 12/17 | 5.32 | 3.34 |
| 6:15 PM 12/17 | 5.33 | 3.38 |
| 6:00 PM 12/17 | 5.32 | 3.34 |
| 5:45 PM 12/17 | 5.31 | 3.29 |
| 5:30 PM 12/17 | 5.32 | 3.34 |
| 5:15 PM 12/17 | 5.31 | 3.29 |
| 5:00 PM 12/17 | 5.31 | 3.29 |
| 4:45 PM 12/17 | 5.32 | 3.34 |
| 4:30 PM 12/17 | 5.3 | 3.24 |
17' -
Water reaches the bottom of the Highway 39 bridge.
13.9' -
On March 10, 2010 the river reached a level of 13.85 feet causing water to flow over Highway 39. In addition, Highway 22 may also be impacted.
10.5' -
There is lowland flooding of agricultural areas adjacent to the river.
| Date | Stage (ft) |
|---|---|
| Mar 14, 2019 | 15.39 |
| Aug 13, 1966 | 13.93 |
| Mar 10, 2010 | 13.85 |
| Feb 21, 1997 | 13.44 |
| Mar 8, 1993 | 12.69 |
| Feb 21, 1982 | 12.35 |
| Mar 18, 1978 | 12.12 |
| Feb 21, 1996 | 12.11 |
| Mar 28, 1960 | 11.7 |
| Feb 8, 2015 | 11.09 |
| Jul 24, 1993 | 11.01 |
| Mar 15, 1979 | 10.87 |
| Feb 21, 2007 | 10.87 |
| Mar 19, 1969 | 10.8 |
| Mar 10, 1995 | 10.78 |
| Jun 15, 1967 | 10.67 |
| Jun 13, 1984 | 10.62 |
| Feb 25, 2021 | 10.61 |
| Feb 5, 2013 | 10.58 |
| Jun 15, 2010 | 10.47 |
Data provided by the National Weather Service.