« Back to Congaree National Park Rivers
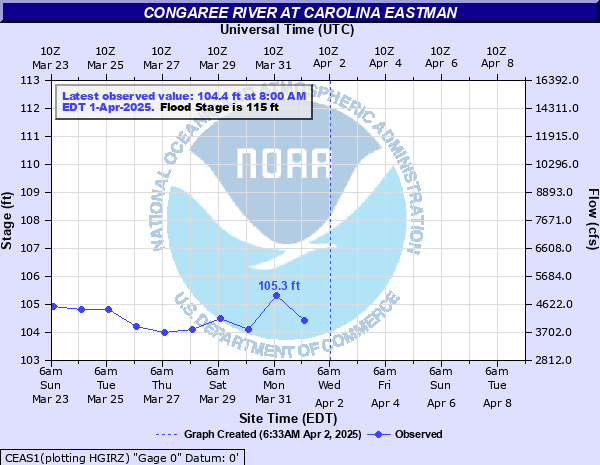
Congaree River at Carolina Eastman
Critical Stages
114' - Action
115' - Flood
119' - Moderate
126' - Major
Latest Observation
Updated: 7:03 PM LMT 12/31/00
Status: Obs Not Current
Stage: -999 ft
Flow: -999 kcfs
Forecast
Forecast not available for this location.
| Time | Stage (ft) | Flow (kcfs) |
|---|---|---|
| 7:00 AM 12/14 | 103 | 2.81 |
| 7:00 AM 12/13 | 102.9 | 2.7 |
| 7:00 AM 12/12 | 103 | 2.81 |
| 7:00 AM 12/11 | 104.4 | 4.05 |
| 7:00 AM 12/10 | 104.4 | 4.05 |
| 7:00 AM 12/9 | 104.7 | 4.32 |
| 7:00 AM 12/8 | 103.3 | 3.16 |
| 7:00 AM 12/7 | 102.8 | 2.59 |
| 7:00 AM 12/6 | 104.5 | 4.14 |
| 7:00 AM 12/5 | 103.2 | 3.06 |
| 7:00 AM 12/4 | 102.9 | 2.7 |
| 7:00 AM 12/3 | 103.2 | 3.06 |
| 7:00 AM 12/2 | 102.8 | 2.59 |
| 7:00 AM 12/1 | 102.7 | 2.48 |
| 7:00 AM 11/30 | 102.7 | 2.48 |
| 7:00 AM 11/29 | 102.6 | 2.38 |
| 7:00 AM 11/28 | 102.9 | 2.7 |
| 7:00 AM 11/27 | 102.4 | 2.18 |
| 7:00 AM 11/26 | 102.3 | 2.09 |
| 7:00 AM 11/25 | 102.3 | 2.09 |
| 7:00 AM 11/24 | 102.4 | 2.18 |
| 7:00 AM 11/23 | 102.4 | 2.18 |
| 8:00 AM 11/22 | 102.8 | 2.59 |
| 8:00 AM 11/21 | 102.9 | 2.7 |
| 8:00 AM 11/20 | 102.8 | 2.59 |
| 8:00 AM 11/19 | 102.7 | 2.48 |
| 8:00 AM 11/18 | 102.2 | 2.01 |
| 8:00 AM 11/17 | 102.3 | 2.09 |
| 8:00 AM 11/16 | 102.3 | 2.09 |
| 8:00 AM 11/15 | 102.3 | 2.09 |
131' -
The floor elevation of some major buildings on the Carolina Eastman Facility are flooded. Extensive farmland and lowland flooding occurs south of Columbia to Lake Marion.
127' -
Portions of the Carolina Eastman facility have to be evacuated.
126' -
Extensive farmland and lowland flooding will occur south of Columbia to Lake Marion. Water reaches the top of some dikes at the Carolina Eastman Facility.
124' -
Extensive flooding occurs at the Carolina Eastman Facility with some access roads flooded. Extensive farmland flooding occurs in the area.
119' -
Extensive flooding occurs in the Congaree National Park. Some area farmland is flooded. Minor flooding occurs at the Carolina Eastman Facility.
115' -
Flooding occurs in low lying areas of the Carolina Eastman Facility and at the Congaree National Park.
| Date | Stage (ft) |
|---|---|
| Oct 12, 1976 | 126.95 |
| Oct 5, 2015 | 126.9 |
| Feb 27, 1979 | 126.9 |
| Sep 30, 2024 | 126.9 |
| Feb 9, 2020 | 126.4 |
| Mar 16, 1975 | 126 |
| Apr 3, 1973 | 125.4 |
| Jan 12, 2024 | 125.2 |
| Jan 1, 2016 | 124.9 |
| Sep 11, 2004 | 124.6 |
| May 9, 2013 | 124.5 |
| Feb 6, 1998 | 124.4 |
| Jan 28, 1978 | 124.2 |
| May 25, 2003 | 124 |
| Mar 4, 2007 | 124 |
| Dec 18, 1972 | 124 |
| Feb 8, 2010 | 123.8 |
| Jan 7, 1982 | 123.7 |
| Jan 27, 2010 | 123.7 |
| Mar 5, 1971 | 123.7 |
Data provided by the National Weather Service.