Eastern Stump Lake near Lakota
Critical Stages
Action
0.1' - Flood
0.2' - Moderate
0.3' - Major
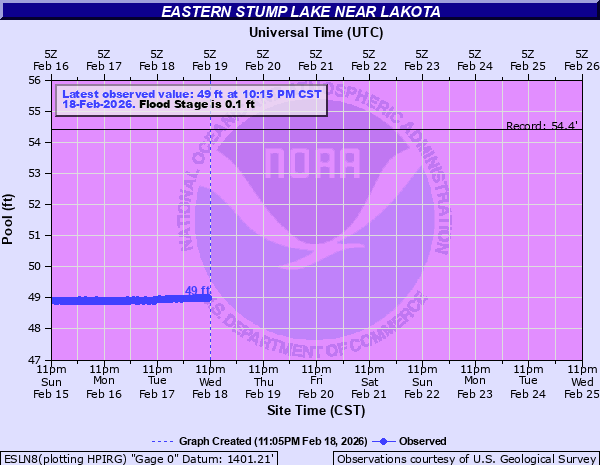
Latest Observation
Updated: 2:15 PM CST 12/15/25
Status: Major
Stage: 48.83 ft
Flow: -999 kcfs
Forecast
Forecast not available for this location.
| Time | Stage (ft) | Flow (kcfs) |
|---|---|---|
| 3:15 PM 12/15 | 48.8 | -999 |
| 3:00 PM 12/15 | 48.78 | -999 |
| 2:45 PM 12/15 | 48.8 | -999 |
| 2:30 PM 12/15 | 48.81 | -999 |
| 2:15 PM 12/15 | 48.83 | -999 |
| 2:00 PM 12/15 | 48.79 | -999 |
| 1:45 PM 12/15 | 48.79 | -999 |
| 1:30 PM 12/15 | 48.82 | -999 |
| 1:15 PM 12/15 | 48.8 | -999 |
| 1:00 PM 12/15 | 48.81 | -999 |
| 12:45 PM 12/15 | 48.79 | -999 |
| 12:30 PM 12/15 | 48.78 | -999 |
| 12:15 PM 12/15 | 48.8 | -999 |
| 12:00 PM 12/15 | 48.81 | -999 |
| 11:45 AM 12/15 | 48.81 | -999 |
| 11:30 AM 12/15 | 48.81 | -999 |
| 11:15 AM 12/15 | 48.8 | -999 |
| 11:00 AM 12/15 | 48.8 | -999 |
| 10:45 AM 12/15 | 48.82 | -999 |
| 10:30 AM 12/15 | 48.79 | -999 |
| 10:15 AM 12/15 | 48.79 | -999 |
| 10:00 AM 12/15 | 48.8 | -999 |
| 9:45 AM 12/15 | 48.82 | -999 |
| 9:30 AM 12/15 | 48.79 | -999 |
| 9:15 AM 12/15 | 48.79 | -999 |
| 9:00 AM 12/15 | 48.81 | -999 |
| 8:45 AM 12/15 | 48.8 | -999 |
| 8:30 AM 12/15 | 48.81 | -999 |
| 8:15 AM 12/15 | 48.81 | -999 |
| 8:00 AM 12/15 | 48.8 | -999 |
59' -
Prior to January 2010, the height that Devils Lake/Stump Lake spills into Sheyenne River through Tolna Coulee. Combined area of Devils and Stump Lakes would be 450 sq mi.
58' -
Tolna Coulee Control Structure spill height (May 2012). Tolna Coulee clean-out height (January 2010).
55.9' -
Elevation of State Highway 1 (raised in 2001).
54.4' -
**** Record level - July 2, 2011 - USGS Max Daily Average ****
51.5' -
Nelson Co. Road 27 flooded.
48' -
Nelson Co. Road 23 (north) flooded.
46.5' -
Approximate height of Jerusalem Coulee from East Lake to West Stump Lake (surveyed by ND SWC 2021).
35' -
Nelson Co. Road 23A flooded.
34' -
Nelson Co. Road 23 (middle) flooded.
25' -
Nelson Co. Road 23 (south) and Nelson Co. Road 15 flooded.
6' -
Nelson Co. Road 4 flooded.
-1' -
West and East Stump Lakes merge.
| Date | Stage (ft) |
|---|---|
| Jul 2, 2011 | 54.4 |
| Jul 9, 2013 | 54 |
| Jul 1, 2014 | 53.58 |
| Apr 7, 2012 | 53.54 |
| Jun 25, 2010 | 52.14 |
| May 17, 2015 | 51.98 |
| May 27, 2017 | 51.75 |
| Jul 23, 2022 | 51.09 |
| Jun 4, 2023 | 50.69 |
| Jul 15, 2009 | 50.68 |
| Jun 17, 2016 | 50.61 |
| Jul 20, 2024 | 50.19 |
| Jun 29, 2018 | 50.13 |
| Jul 8, 2020 | 50.07 |
| Jul 3, 2019 | 49.36 |
| Apr 18, 2021 | 48.54 |
| Aug 11, 2007 | 47.64 |
| Jun 14, 2008 | 47.22 |
| Sep 26, 2006 | 43.97 |
| Sep 30, 2005 | 33.67 |
Data provided by the National Weather Service.