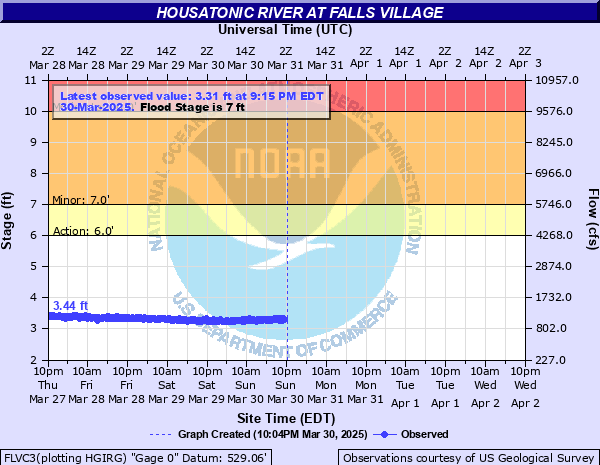
Housatonic River at Falls Village
Critical Stages
6' - Action
7' - Flood
10' - Moderate
15' - Major
Latest Observation
Updated: 9:15 AM EST 12/6/25
Status: No Flooding
Stage: 2.73 ft
Flow: 0.605 kcfs
Forecast
Forecast not available for this location.
| Time | Stage (ft) | Flow (kcfs) |
|---|---|---|
| 10:15 AM 12/6 | 2.71 | 0.592 |
| 10:00 AM 12/6 | 2.73 | 0.605 |
| 9:45 AM 12/6 | 2.73 | 0.605 |
| 9:30 AM 12/6 | 2.72 | 0.598 |
| 9:15 AM 12/6 | 2.73 | 0.605 |
| 9:00 AM 12/6 | 2.73 | 0.605 |
| 8:45 AM 12/6 | 2.71 | 0.592 |
| 8:30 AM 12/6 | 2.72 | 0.598 |
| 8:15 AM 12/6 | 2.72 | 0.598 |
| 8:00 AM 12/6 | 2.72 | 0.598 |
| 7:45 AM 12/6 | 2.72 | 0.598 |
| 7:30 AM 12/6 | 2.73 | 0.605 |
| 7:15 AM 12/6 | 2.72 | 0.598 |
| 7:00 AM 12/6 | 2.72 | 0.598 |
| 6:45 AM 12/6 | 2.72 | 0.598 |
| 6:30 AM 12/6 | 2.72 | 0.598 |
| 6:15 AM 12/6 | 2.72 | 0.598 |
| 6:00 AM 12/6 | 2.73 | 0.605 |
| 5:45 AM 12/6 | 2.73 | 0.605 |
| 5:30 AM 12/6 | 2.72 | 0.598 |
| 5:15 AM 12/6 | 2.72 | 0.598 |
| 5:00 AM 12/6 | 2.72 | 0.598 |
| 4:45 AM 12/6 | 2.72 | 0.598 |
| 4:30 AM 12/6 | 2.72 | 0.598 |
| 4:15 AM 12/6 | 2.72 | 0.598 |
| 4:00 AM 12/6 | 2.73 | 0.605 |
| 3:45 AM 12/6 | 2.71 | 0.592 |
| 3:30 AM 12/6 | 2.71 | 0.592 |
| 3:15 AM 12/6 | 2.72 | 0.598 |
| 3:00 AM 12/6 | 2.72 | 0.598 |
19' -
Flood of record on January 1, 1949.
15' -
Major flood stage.
10' -
Moderate flood stage. The river reaches the edge of several sections of Route 7 north of Cornwall Bridge.
9' -
Water floods Riverside Road at Kent School and begins to approach buildings. Water gets close to Route 7.
8' -
The water reaches Riverside Road at Kent School and floods the picnic area along Route 7 near Housatonic Meadows.
7' -
Flood stage. The park above Falls Village Dam begins to flood, and water reaches the fields of White Hollow Farms near Limerock Road, and is at the edge of the Housatonic Valley Regional High School fields.
5' -
The river is about half bankfull.
| Date | Stage (ft) |
|---|---|
| Jan 1, 1949 | 19 |
| Aug 19, 1955 | 18.9 |
| Sep 23, 1938 | 16.8 |
| Sep 9, 2011 | 13.47 |
| Mar 20, 1936 | 13 |
| Aug 30, 2011 | 11.74 |
| Mar 9, 2011 | 11.57 |
| Apr 18, 2007 | 11.14 |
| Mar 8, 2011 | 11.03 |
| May 31, 1984 | 10.56 |
| Dec 13, 2008 | 10.29 |
| Apr 1, 1993 | 9.71 |
| Apr 4, 2005 | 9.65 |
| Jan 28, 1996 | 9.21 |
| Mar 12, 2011 | 9.11 |
| Dec 19, 2023 | 8.88 |
| Jun 15, 2013 | 8.75 |
| Apr 12, 2001 | 8.56 |
| Sep 3, 2021 | 8.44 |
| Jul 11, 2023 | 8.4 |
Data provided by the National Weather Service.