Hudson River at Troy
Critical Stages
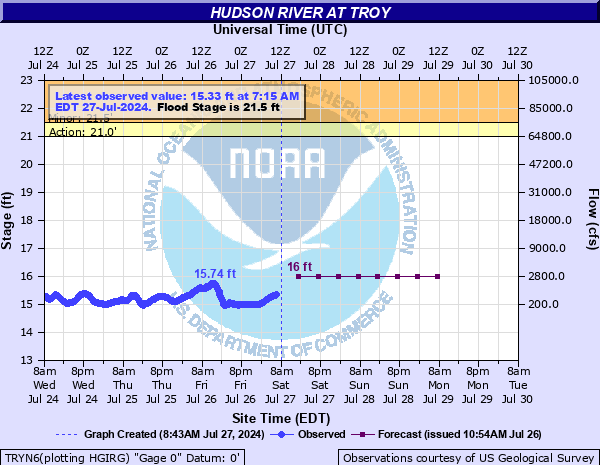
21' - Action
21.5' - Flood
24' - Moderate
27' - Major
Latest Observation
Updated: 9:15 AM EST 12/6/25
Status: No Flooding
Stage: 15.85 ft
Flow: 1.9 kcfs
Forecast
| Time | Stage (ft) | Flow (kcfs) |
|---|---|---|
| 1 PM 12/6 | 16.2 | 3.56 |
| 7 PM 12/6 | 16 | 2.8 |
| 1 AM 12/7 | 16 | 2.8 |
| 7 AM 12/7 | 16 | 2.8 |
| 1 PM 12/7 | 15.9 | 2.17 |
| 7 PM 12/7 | 15.7 | 1.29 |
| 1 AM 12/8 | 15.7 | 1.29 |
| 7 AM 12/8 | 15.8 | 1.67 |
| Time | Stage (ft) | Flow (kcfs) |
|---|---|---|
| 9:15 AM 12/6 | 15.85 | 1.9 |
| 9:00 AM 12/6 | 15.87 | 2.01 |
| 8:45 AM 12/6 | 15.91 | 2.22 |
| 8:30 AM 12/6 | 15.94 | 2.4 |
| 8:15 AM 12/6 | 15.97 | 2.59 |
| 8:00 AM 12/6 | 16 | 2.8 |
| 7:45 AM 12/6 | 16.02 | 2.87 |
| 7:30 AM 12/6 | 16.05 | 2.97 |
| 7:15 AM 12/6 | 16.07 | 3.05 |
| 7:00 AM 12/6 | 16.1 | 3.16 |
| 6:45 AM 12/6 | 16.12 | 3.23 |
| 6:30 AM 12/6 | 16.13 | 3.27 |
| 6:15 AM 12/6 | 16.13 | 3.27 |
| 6:00 AM 12/6 | 16.13 | 3.27 |
| 5:45 AM 12/6 | 16.13 | 3.27 |
| 5:30 AM 12/6 | 16.13 | 3.27 |
| 5:15 AM 12/6 | 16.12 | 3.23 |
| 5:00 AM 12/6 | 16.11 | 3.19 |
| 4:45 AM 12/6 | 16.1 | 3.16 |
| 4:30 AM 12/6 | 16.08 | 3.08 |
| 4:15 AM 12/6 | 16.05 | 2.97 |
| 4:00 AM 12/6 | 16.03 | 2.9 |
| 3:45 AM 12/6 | 16.01 | 2.83 |
| 3:30 AM 12/6 | 15.99 | 2.73 |
| 3:15 AM 12/6 | 15.98 | 2.66 |
| 3:00 AM 12/6 | 15.98 | 2.66 |
| 2:45 AM 12/6 | 15.98 | 2.66 |
| 2:30 AM 12/6 | 15.98 | 2.66 |
| 2:15 AM 12/6 | 15.98 | 2.66 |
| 2:00 AM 12/6 | 15.99 | 2.73 |
29' -
There are several feet of water on Riverside Street, three feet water in the former Cluett-Peabody building, First and Second Streets in Troy are flooded, and the Congress Street Bridge is closed.
27' -
The river is at major flood stage. Water reaches numerous homes in the Village of Wateford and in riverfront sections of Troy. About 4 feet water at foot of State Street.
24' -
The river is at moderate flood stage. Water reaches mobile homes along the river front in Lansingburgh.
23' -
Water reaches streets in Waterford Village and Matsons Shipyard on Van Schaick Island. Some basements flood.
21.5' -
Minor flood stage. Water floods onto the Mohawk Wharf in Village of Waterford.
21' -
Action stage. Water is just six inches below the wharf in Waterford.
| Date | Stage (ft) |
|---|---|
| Mar 28, 1913 | 29.7 |
| Mar 19, 1936 | 29.48 |
| Sep 22, 1938 | 27.1 |
| Dec 31, 1948 | 27.05 |
| Aug 29, 2011 | 27.05 |
| Mar 14, 1977 | 26.53 |
| Jan 20, 1996 | 26.22 |
| Mar 6, 1964 | 24.82 |
| Jan 9, 1998 | 24.77 |
| Apr 5, 1960 | 24.41 |
| Mar 13, 1936 | 24.4 |
| Apr 4, 2005 | 24.22 |
| Sep 9, 2011 | 24.2 |
| Apr 5, 1987 | 23.79 |
| Jun 29, 2006 | 23.67 |
| Dec 19, 2023 | 23.66 |
| Mar 7, 1979 | 23.64 |
| Mar 22, 1980 | 23.62 |
| Mar 30, 1993 | 23.57 |
| Apr 9, 2022 | 23.44 |
Data provided by the National Weather Service.