Hoosic River near Williamstown
Critical Stages
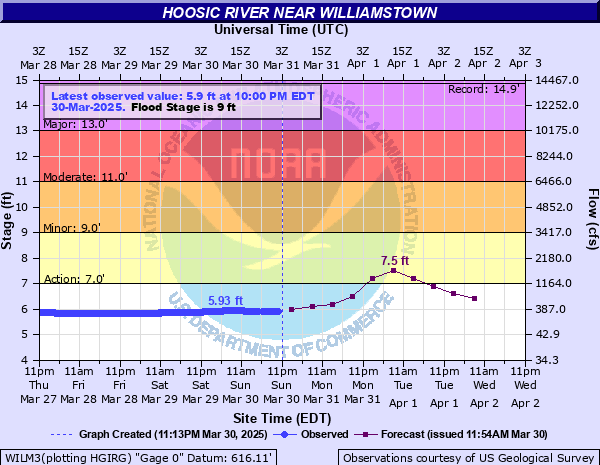
7' - Action
9' - Flood
11' - Moderate
13' - Major
Latest Observation
Updated: 10:00 AM EST 12/6/25
Status: No Flooding
Stage: 5.54 ft
Flow: 0.143 kcfs
Forecast
Forecast not available for this location.
| Time | Stage (ft) | Flow (kcfs) |
|---|---|---|
| 10:00 AM 12/6 | 5.54 | 0.143 |
| 9:45 AM 12/6 | 5.54 | 0.143 |
| 9:30 AM 12/6 | 5.54 | 0.143 |
| 9:15 AM 12/6 | 5.54 | 0.143 |
| 9:00 AM 12/6 | 5.54 | 0.143 |
| 8:45 AM 12/6 | 5.54 | 0.143 |
| 8:30 AM 12/6 | 5.54 | 0.143 |
| 8:15 AM 12/6 | 5.54 | 0.143 |
| 8:00 AM 12/6 | 5.54 | 0.143 |
| 7:45 AM 12/6 | 5.54 | 0.143 |
| 7:30 AM 12/6 | 5.54 | 0.143 |
| 7:15 AM 12/6 | 5.54 | 0.143 |
| 7:00 AM 12/6 | 5.54 | 0.143 |
| 6:45 AM 12/6 | 5.54 | 0.143 |
| 6:30 AM 12/6 | 5.54 | 0.143 |
| 6:15 AM 12/6 | 5.55 | 0.147 |
| 6:00 AM 12/6 | 5.55 | 0.147 |
| 5:45 AM 12/6 | 5.54 | 0.143 |
| 5:30 AM 12/6 | 5.54 | 0.143 |
| 5:15 AM 12/6 | 5.55 | 0.147 |
| 5:00 AM 12/6 | 5.55 | 0.147 |
| 4:45 AM 12/6 | 5.55 | 0.147 |
| 4:30 AM 12/6 | 5.55 | 0.147 |
| 4:15 AM 12/6 | 5.55 | 0.147 |
| 4:00 AM 12/6 | 5.55 | 0.147 |
| 3:45 AM 12/6 | 5.55 | 0.147 |
| 3:30 AM 12/6 | 5.55 | 0.147 |
| 3:15 AM 12/6 | 5.55 | 0.147 |
| 3:00 AM 12/6 | 5.55 | 0.147 |
| 2:45 AM 12/6 | 5.55 | 0.147 |
15' -
Water approaches homes on Kateley Lane and on Berkshire Drive. Water approaches train tracks near Ashton Avenue. Lower Linear Park is almost completely inundated
14.85' -
Reaches level of flood of record from December 1948 which caused major flooding in the Hoosic Valley.
14.58' -
Water reaches the level of flooding from Tropical Storm Irene in August of 2011.
14' -
The Spruces town park floods. Galvin Road is flooded north of Paull Brook, with water approaching several homes.
13' -
Water approaches several homes on North Street.
11' -
Most of Cole Field is inundated, as well as the portion of Stetson Road that runs along Cole Field.
10' -
Water covers the lowest portions of Cole Field.
9' -
Flood stage.
4' -
Normal low water elevation.
| Date | Stage (ft) |
|---|---|
| Dec 31, 1948 | 14.85 |
| Aug 28, 2011 | 14.58 |
| Nov 26, 1950 | 13.85 |
| Aug 10, 1976 | 13.02 |
| Apr 5, 1987 | 12.44 |
| Oct 8, 2005 | 12.35 |
| Dec 21, 1973 | 11.79 |
| Mar 22, 1980 | 10.87 |
| Mar 31, 1987 | 10.7 |
| Apr 18, 1982 | 10.59 |
| Mar 13, 1977 | 10.59 |
| Jul 10, 2023 | 10.33 |
| Jan 19, 1996 | 10.25 |
| Feb 20, 1981 | 10.23 |
| Apr 16, 2007 | 10.14 |
| Apr 3, 2005 | 10.1 |
| Mar 17, 2025 | 9.93 |
| May 30, 1984 | 9.82 |
| Apr 10, 1980 | 9.79 |
| Sep 18, 2018 | 9.78 |
Data provided by the National Weather Service.