« Back to Copper Center Rivers
Gulkana River at Sourdough
Critical Stages
9.5' - Action
11' - Flood
Moderate
Major
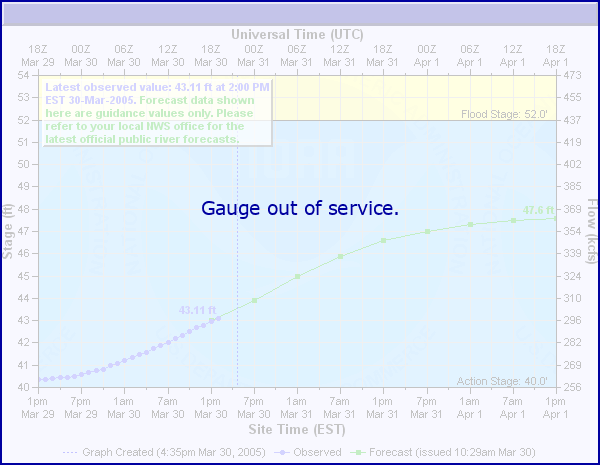
Latest Observation
Updated: 4:15 PM AKST 12/7/25
Status: Out Of Service
Stage: 8.12 ft
Flow: 3.74 kcfs
Forecast
Forecast not available for this location.
| Time | Stage (ft) | Flow (kcfs) |
|---|---|---|
| 8:15 PM 12/16 | -9999 | -999 |
| 8:00 PM 12/16 | -9999 | -999 |
| 7:45 PM 12/16 | -9999 | -999 |
| 7:30 PM 12/16 | -9999 | -999 |
| 7:15 PM 12/16 | -9999 | -999 |
| 7:00 PM 12/16 | -9999 | -999 |
| 6:45 PM 12/16 | -9999 | -999 |
| 6:30 PM 12/16 | -9999 | -999 |
| 6:15 PM 12/16 | -9999 | -999 |
| 6:00 PM 12/16 | -9999 | -999 |
| 5:45 PM 12/16 | -9999 | -999 |
| 5:30 PM 12/16 | -9999 | -999 |
| 5:15 PM 12/16 | -9999 | -999 |
| 5:00 PM 12/16 | -9999 | -999 |
| 4:45 PM 12/16 | -9999 | -999 |
| 4:30 PM 12/16 | -9999 | -999 |
| 4:15 PM 12/16 | -9999 | -999 |
| 4:00 PM 12/16 | -9999 | -999 |
| 3:45 PM 12/16 | -9999 | -999 |
| 3:30 PM 12/16 | -9999 | -999 |
| 3:15 PM 12/16 | -9999 | -999 |
| 3:00 PM 12/16 | -9999 | -999 |
| 2:45 PM 12/16 | -9999 | -999 |
| 2:30 PM 12/16 | -9999 | -999 |
| 2:15 PM 12/16 | -9999 | -999 |
| 2:00 PM 12/16 | -9999 | -999 |
| 1:45 PM 12/16 | -9999 | -999 |
| 1:30 PM 12/16 | -9999 | -999 |
| 1:15 PM 12/16 | -9999 | -999 |
| 1:00 PM 12/16 | -9999 | -999 |
12.5' -
Stage associated with flow (16900 cfs) having a recurrence interval of >50 years; major flooding would be expected on this and nearby streams
12' -
Stage associated with flow (15200 cfs) having a recurrence interval of 20-40 years; moderate flooding would be expected on this and nearby streams
11' -
Stage associated with a flow (11900 cfs) having a recurrence interval of ~10 years; minor flooding would be expected on this and nearby streams
9.5' -
Bankfull -- stage associated with flow (7400 cfs) having a recurrence interval of ~2 years
| Date | Stage (ft) |
|---|---|
| May 7, 1976 | 16.03 |
| May 5, 2009 | 14.64 |
| May 30, 2013 | 14.62 |
| Oct 10, 2006 | 12 |
| Sep 12, 1990 | 11.26 |
| May 4, 1989 | 10.88 |
| Jun 13, 2018 | 10.75 |
| Aug 26, 2006 | 10.48 |
| Jun 14, 2012 | 10.29 |
| Jun 24, 2020 | 10.09 |
| Jun 3, 1992 | 10.08 |
| Jun 2, 1977 | 10.07 |
| May 16, 1973 | 9.92 |
| Jun 4, 1975 | 9.66 |
| May 11, 2015 | 9.58 |
| May 9, 1978 | 9.54 |
| May 10, 2004 | 9.5 |
| Aug 22, 2002 | 9.41 |
| Jun 10, 1997 | 9.36 |
| May 24, 1991 | 8.94 |
Data provided by the National Weather Service.