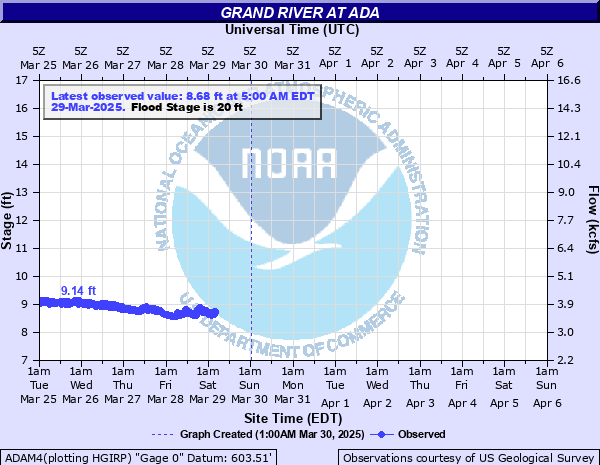
Grand River at Ada
Critical Stages
17' - Action
20' - Flood
22' - Moderate
25' - Major
Latest Observation
Updated: 12:00 PM EST 12/11/25
Status: No Flooding
Stage: 7.02 ft
Flow: 1.5 kcfs
Forecast
Forecast not available for this location.
| Time | Stage (ft) | Flow (kcfs) |
|---|---|---|
| 12:00 PM 12/11 | 7.02 | 1.5 |
| 11:45 AM 12/11 | 7.02 | 1.5 |
| 11:30 AM 12/11 | 7.03 | 1.51 |
| 11:15 AM 12/11 | 7.03 | 1.51 |
| 11:00 AM 12/11 | 7.02 | 1.5 |
| 10:45 AM 12/11 | 7.01 | 1.5 |
| 10:30 AM 12/11 | 7 | 1.49 |
| 10:15 AM 12/11 | 7 | 1.49 |
| 10:00 AM 12/11 | 7 | 1.49 |
| 9:45 AM 12/11 | 7.01 | 1.5 |
| 9:30 AM 12/11 | 6.97 | 1.47 |
| 9:15 AM 12/11 | 6.95 | 1.45 |
| 9:00 AM 12/11 | 6.99 | 1.48 |
| 8:45 AM 12/11 | 6.99 | 1.48 |
| 8:30 AM 12/11 | 7 | 1.49 |
| 8:15 AM 12/11 | 7.02 | 1.5 |
| 8:00 AM 12/11 | 7.04 | 1.52 |
| 7:45 AM 12/11 | 6.98 | 1.47 |
| 7:30 AM 12/11 | 6.96 | 1.46 |
| 7:15 AM 12/11 | 6.96 | 1.46 |
| 7:00 AM 12/11 | 6.99 | 1.48 |
| 6:45 AM 12/11 | 6.98 | 1.47 |
| 6:30 AM 12/11 | 7.01 | 1.5 |
| 6:15 AM 12/11 | 7 | 1.49 |
| 6:00 AM 12/11 | 6.99 | 1.48 |
| 5:45 AM 12/11 | 7 | 1.49 |
| 5:30 AM 12/11 | 7.01 | 1.5 |
| 5:15 AM 12/11 | 6.99 | 1.48 |
| 5:00 AM 12/11 | 6.98 | 1.47 |
| 4:45 AM 12/11 | 6.98 | 1.47 |
29' -
Alticor Inc. Catalog and Powder Complex flood.
27' -
Alticor Inc. buildings number 34 and 58 flood.
24.5' -
Inner dike along Alticor Inc. overtopped. East complex on Alticor Inc. floods.
21.6' -
500 parking spaces in the Alticor Inc. parking lot are inundated and one gate into the Alticor Inc. complex is closed due to the high water. Ada River Walk near Covered Bridge and Leonard Field Ball Park in Ada flooded.
20.7' -
Floodwaters begin to affect walkways along the river near downtown Ada.
20.5' -
Chief Hazy Cloud Park downstream of gage begins to flood.
20' -
Expect minor flooding of low lying areas.
17' -
River is bankfull. Shady Drive floods.
13' -
Water starts to impact low spots on the walking and biking trails along the river in Roselle Park.
| Date | Stage (ft) |
|---|---|
| Apr 21, 2013 | 22.81 |
| Feb 24, 2018 | 22.56 |
| May 21, 2020 | 21.62 |
| Feb 28, 1986 | 21.6 |
| May 26, 2004 | 21.56 |
| Feb 28, 1985 | 21.55 |
| Apr 8, 2023 | 21.01 |
| Mar 8, 1976 | 20.75 |
| Feb 24, 1997 | 20.72 |
| Oct 10, 1986 | 20.65 |
| Mar 18, 1982 | 20.65 |
| Dec 31, 2008 | 20.05 |
| Oct 4, 1981 | 20 |
| Apr 9, 2017 | 19.89 |
| Apr 23, 1975 | 19.45 |
| Apr 4, 1985 | 19.22 |
| Mar 8, 1974 | 18.95 |
| May 21, 2000 | 18.84 |
| Jan 5, 1973 | 18.72 |
| Feb 13, 2001 | 18.26 |
Data provided by the National Weather Service.